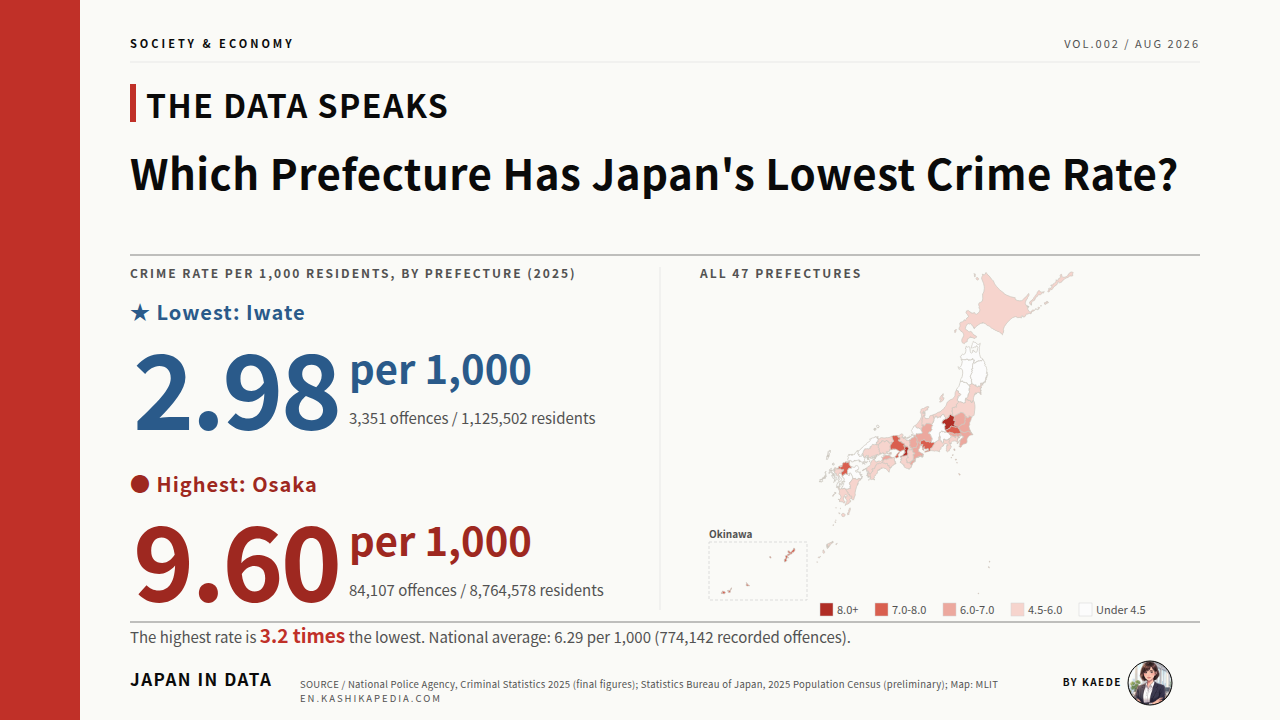

When you read a ranking of Japan’s 47 prefectures, it helps to keep two views apart: the raw number of recorded offences, and the rate per 1,000 residents. Placing the tile map next to the full table shows at a glance which regions sit low and which sit high.
In 2025, the lowest crime rate among Japan’s 47 prefectures was 2.98 per 1,000 residents, in Iwate. Akita followed at 3.00, and the highest was Osaka at 9.60. Police nationwide recorded 774,142 Penal Code offences over the year, an average of about one every 41 seconds. The distance between Iwate at the bottom and Osaka at the top is about 3.2 times.
This article combines prefecture level offence counts from the National Police Agency’s Criminal Statistics (January to December 2025, final figures) with population figures from the 2025 Population Census, Preliminary Tabulation. The editorial team calculated the rate per 1,000 residents for all 47 prefectures and ranked them. The charts also show how the order changes depending on whether counts or rates are used.
Japan is divided into 47 prefectures, the top tier of local government, ranging from Tokyo with 14.2 million residents to Tottori with 524,000. The figures used here are recorded offences: cases the police registered through reports or arrests, which is not the same as the number of crimes committed. A rate is recorded offences divided by resident population, multiplied by 1,000. The population denominator comes from the 2025 Population Census preliminary tabulation, taken on October 1, 2025.
Which prefecture has the lowest crime rate in Japan?
Iwate, at 2.98 per 1,000 residents. Akita follows at 3.00, and Osaka, the highest at 9.60, is about 3.2 times Iwate.
Researched and edited by Kaede, Data Editor, Japan in Data. Based in Saitama, Japan. Figures are current as of publication. Statistics, rules and services can change, so please check the official sources for the latest information.
- Iwate Has the Lowest Rate: All 47 Prefectures Mapped
- All 47 Prefectures Ranked: Switch by Region
- Counts and Rates Give Different Leaders: Tokyo, Osaka, Gunma, Iwate
- Where the Low and High Prefectures Cluster: Distribution by Region
- Is Crime Rising Nationwide? Four Straight Years of Increase
- How to Read These Figures: Three Things Behind the Numbers
- Kaede’s Summary: Clusters Matter More Than Positions
- Frequently Asked Questions
- 🔍 About the Fact-Check for This Article
Iwate Has the Lowest Rate: All 47 Prefectures Mapped
Laid out as a tile map, the 47 prefectures fall into clear regional groupings. Lighter tiles mark lower rates and deeper red marks higher ones. Start with the map as a whole.
* Compiled and edited by the Japan in Data editorial team based on official government statistics.
The lowest 2025 crime rate per 1,000 residents was 2.98 in Iwate, just 0.02 below Akita at 3.00. Yamagata (3.21), Nagasaki (3.42) and Shimane (3.45) come next. The lower end is filled by prefectures in Tohoku, the San’in coast and western Kyushu. On the tile map, a pale band runs from Tohoku down the Sea of Japan coast.
At the other end, Osaka stands at 9.60, followed by Gunma at 8.18 and by Fukuoka and Aichi at 7.59. The exact gap between Iwate and Akita is 0.024, small enough that the order could swap when the preliminary population is replaced by the final census count. This article therefore reports the top position together with the fact that it is a very narrow margin.
All 47 Prefectures Ranked: Switch by Region
This table is where you can find any prefecture’s position. Switching tabs changes the regional block on view, and all 47 prefectures remain on the page either way.
The table below lists all 47 prefectures in order of crime rate, from the lowest upward. Each row shows the rank, the rate, the recorded offence count and the population together. The tabs switch the view to regional blocks, from Hokkaido and Tohoku through to Kyushu and Okinawa.
All 47 prefectures by crime rate, 2025 (lowest first)
| Rank | Prefecture | Rate | Offences | Population |
|---|---|---|---|---|
| 1 | Iwate | 2.98 | 3,351 | 1,125,502 |
| 2 | Akita | 3.00 | 2,647 | 882,100 |
| 3 | Yamagata | 3.21 | 3,191 | 993,127 |
| 4 | Nagasaki | 3.42 | 4,209 | 1,232,190 |
| 5 | Shimane | 3.45 | 2,173 | 629,460 |
| 6 | Oita | 3.85 | 4,151 | 1,076,875 |
| 7 | Yamaguchi | 3.89 | 4,921 | 1,264,006 |
| 8 | Aomori | 4.09 | 4,665 | 1,140,395 |
| 9 | Nagano | 4.14 | 8,085 | 1,954,950 |
| 10 | Yamanashi | 4.22 | 3,292 | 779,912 |
| 11 | Kumamoto | 4.49 | 7,529 | 1,678,090 |
| 12 | Fukui | 4.49 | 3,276 | 729,386 |
| 13 | Wakayama | 4.57 | 3,946 | 864,262 |
| 14 | Miyazaki | 4.63 | 4,717 | 1,018,904 |
| 15 | Niigata | 4.69 | 9,707 | 2,068,476 |
| 16 | Tokushima | 4.78 | 3,231 | 675,489 |
| 17 | Hokkaido | 4.84 | 24,150 | 4,985,419 |
| 18 | Nara | 4.94 | 6,265 | 1,269,180 |
| 19 | Ishikawa | 4.94 | 5,376 | 1,088,221 |
| 20 | Kyoto | 4.95 | 12,398 | 2,502,747 |
| 21 | Miyagi | 5.06 | 11,260 | 2,227,240 |
| 22 | Fukushima | 5.07 | 8,674 | 1,711,937 |
| 23 | Shizuoka | 5.15 | 17,856 | 3,468,845 |
| 24 | Saga | 5.33 | 4,162 | 781,214 |
| 25 | Toyama | 5.41 | 5,337 | 985,675 |
| 26 | Kanagawa | 5.44 | 50,059 | 9,193,657 |
| 27 | Hiroshima | 5.49 | 14,735 | 2,683,399 |
| 28 | Ehime | 5.51 | 6,947 | 1,260,088 |
| 29 | Kagoshima | 5.58 | 8,441 | 1,512,969 |
| 30 | Kochi | 5.64 | 3,630 | 643,437 |
| 31 | Okayama | 5.68 | 10,267 | 1,808,664 |
| 32 | Tottori | 5.81 | 3,045 | 523,732 |
| 33 | Shiga | 6.23 | 8,669 | 1,392,439 |
| 34 | Mie | 6.31 | 10,692 | 1,694,896 |
| 35 | Chiba | 6.39 | 39,976 | 6,258,512 |
| 36 | Gifu | 6.79 | 12,847 | 1,891,489 |
| 37 | Tochigi | 6.85 | 12,780 | 1,864,833 |
| 38 | Ibaraki | 6.90 | 19,273 | 2,791,207 |
| 39 | Tokyo | 6.97 | 99,349 | 14,246,219 |
| 40 | Kagawa | 6.98 | 6,334 | 907,725 |
| 41 | Okinawa | 7.27 | 10,677 | 1,468,220 |
| 42 | Saitama | 7.34 | 53,471 | 7,287,169 |
| 43 | Hyogo | 7.49 | 39,899 | 5,323,825 |
| 44 | Aichi | 7.59 | 56,515 | 7,449,403 |
| 45 | Fukuoka | 7.59 | 38,577 | 5,081,879 |
| 46 | Gunma | 8.18 | 15,283 | 1,867,582 |
| 47 | Osaka | 9.60 | 84,107 | 8,764,578 |
| Rank | Prefecture | Rate | Offences | Population |
|---|---|---|---|---|
| 1 | Iwate | 2.98 | 3,351 | 1,125,502 |
| 2 | Akita | 3.00 | 2,647 | 882,100 |
| 3 | Yamagata | 3.21 | 3,191 | 993,127 |
| 8 | Aomori | 4.09 | 4,665 | 1,140,395 |
| 17 | Hokkaido | 4.84 | 24,150 | 4,985,419 |
| 21 | Miyagi | 5.06 | 11,260 | 2,227,240 |
| 22 | Fukushima | 5.07 | 8,674 | 1,711,937 |
| Rank | Prefecture | Rate | Offences | Population |
|---|---|---|---|---|
| 26 | Kanagawa | 5.44 | 50,059 | 9,193,657 |
| 35 | Chiba | 6.39 | 39,976 | 6,258,512 |
| 37 | Tochigi | 6.85 | 12,780 | 1,864,833 |
| 38 | Ibaraki | 6.90 | 19,273 | 2,791,207 |
| 39 | Tokyo | 6.97 | 99,349 | 14,246,219 |
| 42 | Saitama | 7.34 | 53,471 | 7,287,169 |
| 46 | Gunma | 8.18 | 15,283 | 1,867,582 |
| Rank | Prefecture | Rate | Offences | Population |
|---|---|---|---|---|
| 9 | Nagano | 4.14 | 8,085 | 1,954,950 |
| 10 | Yamanashi | 4.22 | 3,292 | 779,912 |
| 12 | Fukui | 4.49 | 3,276 | 729,386 |
| 15 | Niigata | 4.69 | 9,707 | 2,068,476 |
| 19 | Ishikawa | 4.94 | 5,376 | 1,088,221 |
| 23 | Shizuoka | 5.15 | 17,856 | 3,468,845 |
| 25 | Toyama | 5.41 | 5,337 | 985,675 |
| 36 | Gifu | 6.79 | 12,847 | 1,891,489 |
| 44 | Aichi | 7.59 | 56,515 | 7,449,403 |
| Rank | Prefecture | Rate | Offences | Population |
|---|---|---|---|---|
| 13 | Wakayama | 4.57 | 3,946 | 864,262 |
| 18 | Nara | 4.94 | 6,265 | 1,269,180 |
| 20 | Kyoto | 4.95 | 12,398 | 2,502,747 |
| 33 | Shiga | 6.23 | 8,669 | 1,392,439 |
| 34 | Mie | 6.31 | 10,692 | 1,694,896 |
| 43 | Hyogo | 7.49 | 39,899 | 5,323,825 |
| 47 | Osaka | 9.60 | 84,107 | 8,764,578 |
| Rank | Prefecture | Rate | Offences | Population |
|---|---|---|---|---|
| 5 | Shimane | 3.45 | 2,173 | 629,460 |
| 7 | Yamaguchi | 3.89 | 4,921 | 1,264,006 |
| 16 | Tokushima | 4.78 | 3,231 | 675,489 |
| 27 | Hiroshima | 5.49 | 14,735 | 2,683,399 |
| 28 | Ehime | 5.51 | 6,947 | 1,260,088 |
| 30 | Kochi | 5.64 | 3,630 | 643,437 |
| 31 | Okayama | 5.68 | 10,267 | 1,808,664 |
| 32 | Tottori | 5.81 | 3,045 | 523,732 |
| 40 | Kagawa | 6.98 | 6,334 | 907,725 |
| Rank | Prefecture | Rate | Offences | Population |
|---|---|---|---|---|
| 4 | Nagasaki | 3.42 | 4,209 | 1,232,190 |
| 6 | Oita | 3.85 | 4,151 | 1,076,875 |
| 11 | Kumamoto | 4.49 | 7,529 | 1,678,090 |
| 14 | Miyazaki | 4.63 | 4,717 | 1,018,904 |
| 24 | Saga | 5.33 | 4,162 | 781,214 |
| 29 | Kagoshima | 5.58 | 8,441 | 1,512,969 |
| 41 | Okinawa | 7.27 | 10,677 | 1,468,220 |
| 45 | Fukuoka | 7.59 | 38,577 | 5,081,879 |
* Compiled and edited by the Japan in Data editorial team based on official government statistics.
Aichi and Fukuoka both display 7.59. On the exact figures Fukuoka is slightly higher, so counting from the lowest rate Aichi is placed 44th and Fukuoka 45th. Reading down the offence column also shows that the rate order and the size of the count do not line up.
Counts and Rates Give Different Leaders: Tokyo, Osaka, Gunma, Iwate
Counts tend to grow with population size. These four prefectures show how the order shifts once the figure is converted to a rate per resident.
* Compiled and edited by the Japan in Data editorial team based on official government statistics.
Tokyo recorded the largest number of offences, 99,349, but its rate of 6.97 places it 39th counting from the lowest, or 9th counting from the highest. Gunma, 11th by count with 15,283 offences, moves to second from the top at 8.18. Whether the measure is counts or rates, the names at the top change substantially.
Osaka sits near the top on both measures, second by count and highest by rate. Iwate sits at the low end on both, third from the bottom by count and lowest by rate. Because counts track population size so directly, comparing regions usually starts from the rate per resident. That is why the ranking in this article is built on rates.
Where the Low and High Prefectures Cluster: Distribution by Region
Setting the top and bottom ten bars beside the regional distribution turns the shading seen on the tile map into visible regional groupings.
* Compiled and edited by the Japan in Data editorial team based on official government statistics.
The ten lowest are four Tohoku prefectures (Iwate, Akita, Yamagata, Aomori), two in the Chugoku region (Shimane, Yamaguchi), two in Kyushu (Nagasaki, Oita) and two inland Chubu prefectures (Nagano, Yamanashi). The low end is concentrated in Tohoku, the San’in coast, western Kyushu and inland Chubu. The ten highest combine the three metropolitan areas (Osaka, Aichi, Hyogo, Saitama, Tokyo) with northern Kanto (Gunma, Ibaraki) and with Fukuoka, Okinawa and Kagawa.
* Compiled and edited by the Japan in Data editorial team based on official government statistics.
In the regional distribution, the Kanto and Kinki ranges sit to the right, on the higher side, while Tohoku and Chugoku and Shikoku sit to the left. In northern Kanto, Gunma at 8.18, Ibaraki at 6.90 and Tochigi at 6.85 all came in above the national figure of 6.29. The lowest in Kanto is Kanagawa at 5.44, and no Kanto prefecture is near the level of Iwate or Akita.
Is Crime Rising Nationwide? Four Straight Years of Increase
As background to the comparison across the 47 prefectures, here is one chart of the national trend. The marker at the start of the line is the turning point.
* Compiled and edited by the Japan in Data editorial team based on official government statistics.
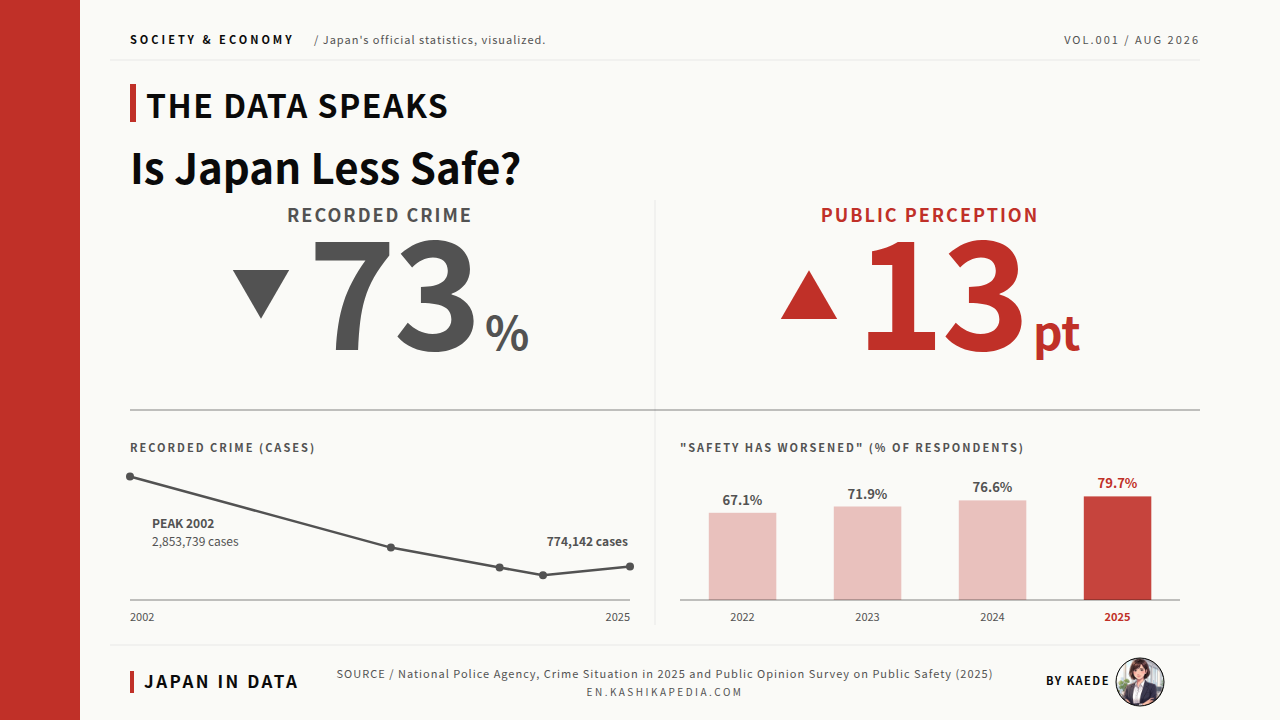
Recorded Penal Code offences fell to 568,148 in 2021, the lowest figure of the postwar era, then rose for four consecutive years to 774,142 in 2025. That is 36,463 more than the previous year, an increase of 4.9%. The 2025 total stands about 3.4% above the pre-pandemic 2019 figure of 748,559.
According to the National Police Agency’s Crime Situation in 2025, intellectual offences and moral offences account for much of the growth since 2019, while larceny, which makes up most of the total, has not returned to its 2019 level. The prefecture ranking in this article is a single cross section of 2025, taken during this rise from the postwar low.
How to Read These Figures: Three Things Behind the Numbers
Before reading the ranking, three points about how this rate is built. Knowing what the number is makes it easier to read.
* Compiled and edited by the Japan in Data editorial team based on official government statistics.
First, recorded offences are the cases police registered through reports and arrests, which is not the same as every crime committed. Second, the denominator is the nighttime resident population, so prefectures that take in commuters, students and visitors during the day tend to show higher rates. Tokyo’s rate of 6.97 is understood to carry that day and night population difference.
Third, the denominator is the preliminary tabulation of the 2025 Population Census, with the final figures due by September 2026. Narrow gaps such as Iwate at 2.98 and Akita at 3.00 could reverse once the final figures replace them. The per capita figures published in the National Police Agency’s Crime Situation in 2025 use the population as of October 1, 2024, a different denominator from the rates calculated here.
Kaede’s Summary: Clusters Matter More Than Positions
Here are three observations drawn from the tile map, the table, the comparison and the distribution. The structure behind the positions is worth taking away along with the numbers.
The answer to the question of which prefecture has the lowest crime rate is Iwate, at 2.98. That figure is one cross section, calculated by the editorial team from final offence counts and a preliminary population. The picture changes with the measure chosen and with the year of the denominator. The observations from the charts follow.
Taken together, the three observations suggest how this ranking can be used. The regional clustering at each end, and the way counts and rates change the picture, carry more than the positions themselves. The same reading carries over to other years and to municipal level data. Watching the annual change as a fixed observation point, while keeping the nature of the figures in mind, is how I approach a ranking of this kind.
Frequently Asked Questions
Three questions that come up often about this ranking, mostly on the calculation and on how to read the figures.
Q1. How is the crime rate calculated?
Prefecture level Penal Code offence counts from Table 3 of the National Police Agency’s Criminal Statistics (January to December 2025, final figures) are divided by the population as of October 1, 2025 from the 2025 Population Census, Preliminary Tabulation, then multiplied by 1,000. For Iwate that is 3,351 ÷ 1,125,502 × 1,000 = 2.98. The denominator is preliminary, so narrow gaps may reorder once the final figures appear.
Q2. Does a low crime rate mean the prefecture is safe?
That does not follow directly. Recorded offences are the cases police registered, not the true incidence. Because the denominator is the resident population, prefectures with large daytime populations tend to show higher rates. This article sets out only the observation that rates are lower or higher; it does not assess prefectures as safe or dangerous. Anyone using the figures for a housing decision may want to read them alongside the breakdown by offence type and municipal level data.
Q3. Is municipal level data available for my prefecture?
Many prefectural police forces publish recorded offence counts for each city, town and village within their prefecture, and those releases are the primary source for municipal level rates. Japan in Data currently covers this ranking at the national level, and municipal breakdowns are planned as the series expands.
🔍 About the Fact-Check for This Article
Japan in Data fact-checks its articles. The evidence behind the figures on this page is set out below.