Welcome to Japan in Data!

I’m Kaede, the editor of this site.
When official data is turned into charts, patterns and shifts emerge that are easy to miss when you only read the numbers.
I keep opinions and predictions to a minimum, and simply lay out what the data shows.
Pick any article that catches your eye, and enjoy.
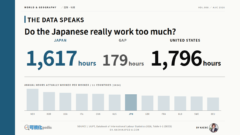
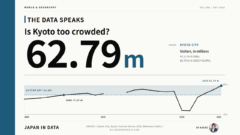
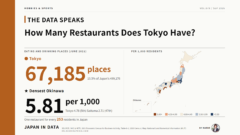
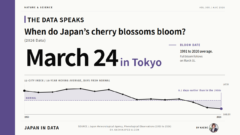
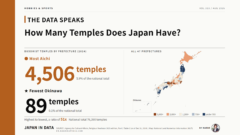
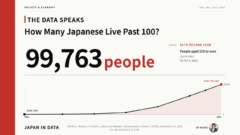
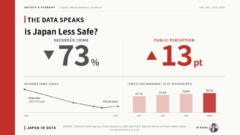
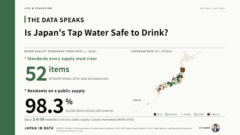
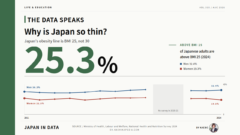
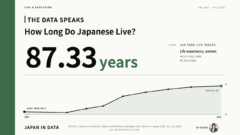
About This Site
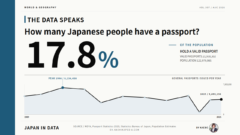
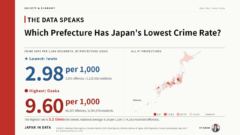
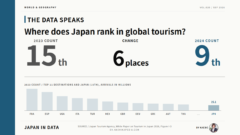
Japan in Data is a data visualization site that turns Japan’s official statistics and primary sources into charts and long-run graphs. It is a place to re-examine the numbers people vaguely “know” about Japan, using clearly sourced data and visuals.
■ Built on primary sources only
Every article is based on verifiable official data: government statistics, international organizations, and official filings. Each article includes a fact-check section listing every source we used, and all figures are the latest confirmed values at the time of writing.
■ Structures you can’t see in text, shown as charts
Trends, distributions, comparisons, and mechanisms are hard to grasp in prose. Each article is built around visualizations embedded directly in the page, so there is nothing to download and nothing to wait for: you see the shape of the data, not just the numbers.
■ No judgments, no predictions
You will not find “should,” “bad,” or “will probably” here. We lay out the facts in the data as observations, and leave the judgment to you. That is the editorial policy of this site.
Articles are organized into five categories: Society & Economy, Life & Education, Hobbies & Sports, Nature & Science, and World & Geography, edited by Kaede.