
The quickest way into this question is to put two lines side by side: the long-run trend in recorded crime, and the short-run trend in how safe people say they feel. Once both are on the same page, the distance between them is easy to see.
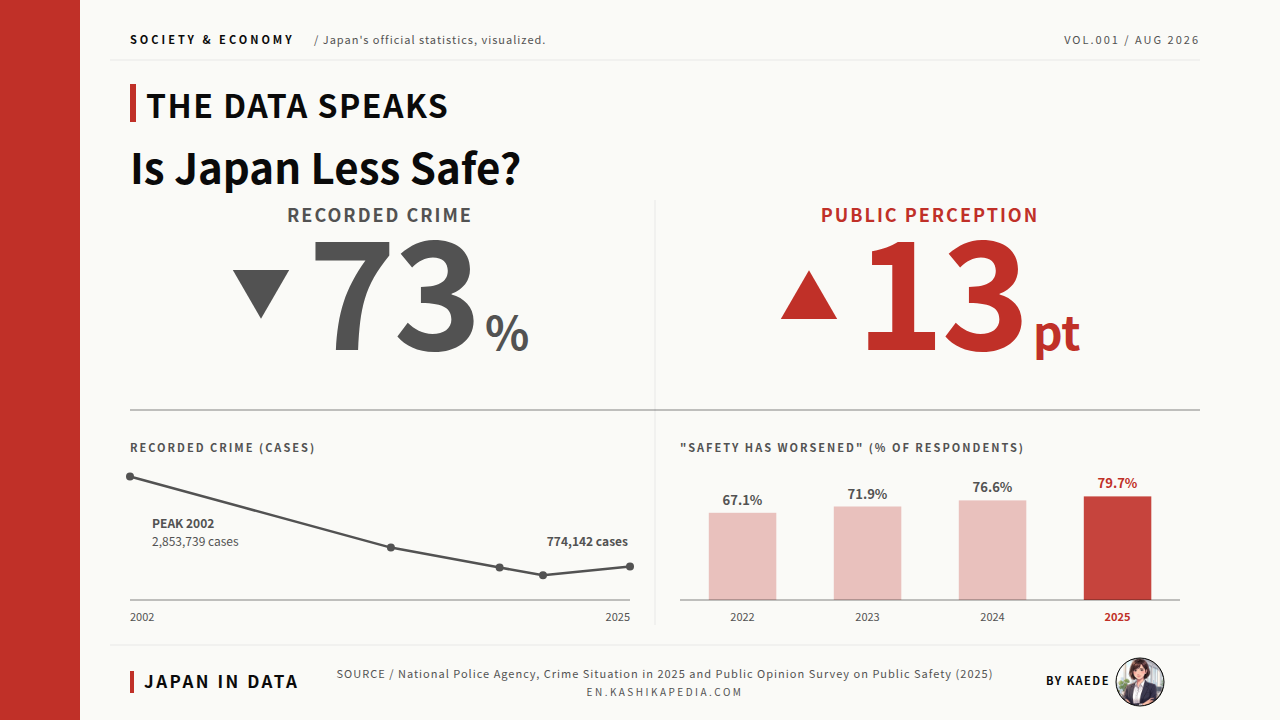
Many people in Japan say the country has become less safe. The official statistics point the other way. According to the National Police Agency, recorded Penal Code offenses fell from a peak of 2,853,739 in 2002 to 774,142 in 2025, a decline of about 73% over 23 years.
The same agency’s Public Opinion Survey on Public Safety found that 79.7% of respondents in 2025 said safety had worsened over the past ten years, the highest reading recorded and a fourth consecutive annual rise. A large fall in recorded crime and a record share reporting worsening safety are running at the same time.
This article works from the primary sources: the National Police Agency’s Crime Situation in 2025, its 2025 Police White Paper statistics, and its Public Opinion Survey on Public Safety. The figures are set out as a long-run column chart, a survey line chart, a 47-prefecture tile map, and a comparison of media exposure with direct experience.
Japan’s crime figures come from the National Police Agency, which compiles reports from 47 prefectural police forces. The headline measure is ninchi kensu, the number of Penal Code offenses recognized by police. It counts cases known to the police rather than convictions, and excludes traffic offenses and special-law offenses. Prefectures are Japan’s 47 top-level regions, from Tokyo to rural Akita. Unless stated otherwise, figures here follow the calendar year, not the April to March fiscal year.
Has Japan actually become less safe?
Recorded crime is down 73% over 23 years. Perceived safety is at its worst reading on record.
This article was researched and edited by Kaede. Figures are current as of the time of writing. Statistics, rules and services are subject to change, so please check the official sources for the latest information.
- Recorded Crime, 2002 to 2025: What the Long Run Shows
- Four Straight Years of Increase: 2025 Passes the Pre-COVID Level
- Perception Moves the Other Way: Four Straight Years of Worsening
- Breaking Down the Increase: Which Offense Groups Rose
- Fraud Losses: Two Records Set in the Same Year
- Prefecture by Prefecture: Recorded Offenses per 1,000 People
- Kaede’s Summary: Three Observations on Data and Perception
- Frequently Asked Questions
- 🔍 About the Fact-Check for This Article
Recorded Crime, 2002 to 2025: What the Long Run Shows
Twenty-three years reads faster as columns than as a table. Set at five turning points, the peak, the halfway mark, the low and the current level line up in a single view.
* Compiled and edited by the Japan in Data editorial team based on official government statistics.
Recorded Penal Code offenses peaked in 2002 at 2,853,739. National Police Agency figures show a steady fall from there: about 2.79 million in 2003, about 2.57 million in 2004, and 1,212,163 by 2014. The 2014 total was roughly half the peak, twelve years on. Few of Japan’s long-running social statistics have moved that far in twelve years.
The decline continued through the late 2010s. In 2019, the year before COVID-19 spread in Japan, the total stood at 748,559. During the pandemic years it fell further, reaching 568,104 in 2021, the lowest figure of the postwar period. Measured against 2002, that is about one-fifth of the peak.
2022 marked a turning point. The total rose to about 601,000 in 2022, about 703,000 in 2023 and 737,679 in 2024. In 2025 it reached 774,142, about 3.4% above the 2019 level and a fourth consecutive annual increase.
Set against the 2002 peak, however, 2025 remains about 73% lower. Read on its own, the series holds two movements at once: a large fall across 23 years, and a recovery from the low across the last four.
Four Straight Years of Increase: 2025 Passes the Pre-COVID Level
The four years of increase look different once each year’s change is drawn separately. The first rebound is wide, the ones after it narrower, and none of them turns back.
* Compiled and edited by the Japan in Data editorial team based on official government statistics.
Year on year, the total rose about 5.8% in 2022, about 17.0% in 2023, about 4.9% in 2024 and about 4.9% again in 2025. The widest rise came in 2023, the year movement and commercial activity resumed broadly after the pandemic. The rises since then are narrower, but the direction has not changed.
The 2025 figure carries a further point. At 774,142, it stands about 3.4% above the 2019 level of 748,559. If the increase were only a rebound from the pandemic, the 2019 level would mark its ceiling. The 2025 total sits above that level instead, on a fourth consecutive year of increase.
Against the 2002 peak of 2,853,739, though, the 2025 total is a little over a quarter. The same series supports two readings depending on the window chosen: a rise across three years, or a historic low across 23. Which reading appears depends on where the eye is placed.
Perception Moves the Other Way: Four Straight Years of Worsening
A single year’s number says less than the shape across years. Four points that move in one direction only are not a common pattern in survey series.
* Compiled and edited by the Japan in Data editorial team based on official government statistics.
The National Police Agency’s Public Opinion Survey on Public Safety asks whether Japan has become less safe over the past ten years. The share answering that it had worsened was 67.1% in 2022, 71.9% in 2023, 76.6% in 2024 and 79.7% in 2025, rising for four consecutive years.
Four consecutive annual increases, each larger than the last, is a new pattern in this series. Recorded crime also rose over the same period, but at around 5% a year, a pace that does not track the movement in the survey.
What People Base That Judgment On: Media Exposure and Direct Experience
* Compiled and edited by the Japan in Data editorial team based on official government statistics.
Respondents who said safety had worsened were asked what their judgment rested on, with multiple answers allowed. The most common was seeing crime reported on television and in newspapers, at 76.4%. Recalling phone and impersonation fraud followed at 72.0%, and crime stories in online news at 61.1%. Saying that the respondent or a family member had been a victim came to 14.2%.
The figures indicate that judgments about safety are formed more through exposure to crime information than through direct experience. Media exposure at 76.4% is about 5.4 times the 14.2% who cited direct experience.
How often someone encounters crime coverage can change quickly with editorial attention, while the chance of being a victim moves slowly. Over the same four years, losses from special fraud and from SNS-based investment fraud set successive records, a subject that drew sustained coverage.
Breaking Down the Increase: Which Offense Groups Rose
Set against 2019, the five offense groups point in different directions. Some bars run well past the pre-pandemic line, and one is still short of it.
* Compiled and edited by the Japan in Data editorial team based on official government statistics.
Broken into the National Police Agency’s five offense groups, the 2025 totals differ sharply against 2019. Moral offenses, covering gambling and obscenity, rose 132.0% to 20,204 cases. Intellectual offenses, covering fraud and forgery, rose 115.0% to 77,473. Felonious offenses, covering murder, robbery and arson, rose 54.8% to 7,287.
Violent offenses rose 9.0% to 61,850, close to the pre-pandemic level. Larceny, the largest group by volume, stood at 513,931 cases, still 3.5% below 2019. The increase is concentrated in the intellectual and moral groups rather than in larceny, and the composition of the total is shifting with it.
Larceny rose 2.5% between 2024 and 2025, a small move. The largest group by volume has not returned to its earlier level, while two smaller groups have more than doubled. The next section turns to the losses recorded in fraud cases.
Fraud Losses: Two Records Set in the Same Year
For fraud, the amount lost carries the scale better than the case count. Laid out by category, two of the three 2025 totals are the largest yet recorded.
* Compiled and edited by the Japan in Data editorial team based on official government statistics.
Total losses from property crime came to 498.4 billion yen in 2025, up 23.9% on the previous year. Fraud accounted for 402.9 billion yen of that, up 31.1% and more than 80% of the property crime total.
Within fraud, special fraud, the category covering phone and impersonation scams, reached 141.4 billion yen, up 96.7% and a record. SNS-based investment fraud and romance fraud together reached 182.7 billion yen, up 43.6% and also a record. Both categories set records in the same year.
Case counts and loss amounts move on separate scales. The number of recorded offenses remains about 73% below its 2002 level, while property crime losses have grown steeply. Offenses that conclude on the street have fallen; offenses that move money through telecommunications and financial channels have grown.
Prefecture by Prefecture: Recorded Offenses per 1,000 People
For 47 prefectures, a tile map reads faster than a table. Where the darker tiles cluster is visible at a glance.
* Compiled and edited by the Japan in Data editorial team based on official government statistics.
Prefecture-level figures for 2025 had not been published in full at the time of writing, so this section uses the 2024 final figures. Combining National Police Agency data with the Statistics Bureau’s population estimates for October 1, 2024, the national figure was 5.96 recorded offenses per 1,000 people.
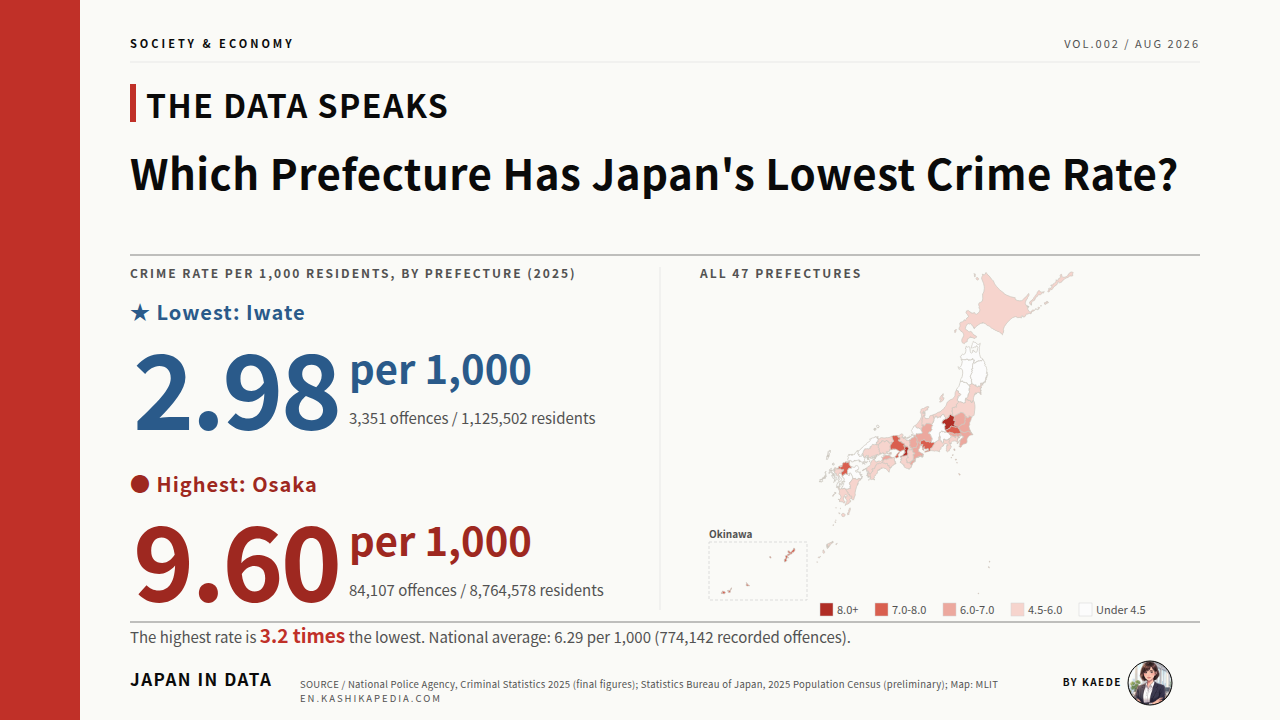
Osaka Prefecture was highest at 9.30 per 1,000, followed by Gunma at 7.80, Ibaraki at 7.47, Fukuoka at 7.27 and Saitama at 7.05. Akita Prefecture was lowest at 2.83, followed by Iwate at 2.85, Yamagata at 3.00, Oita at 3.17 and Nagasaki at 3.19. The gap between Osaka and Akita is about 3.3 times.
Four of the five highest sit in the greater Tokyo or Kansai areas, with Fukuoka as a regional hub. The five lowest sit in the Tohoku region and western Kyushu. On the map, the darker tiles follow dense population and large entertainment districts. The measure describes where offenses are recorded, not how each prefecture is policed.
The same question, whether Japan has become less safe, therefore starts from a different place depending on where a reader lives.
Kaede’s Summary: Three Observations on Data and Perception
Laid end to end, the trends and the regional spread show where the recorded figures and the survey responses part company. Three observations follow.
The figures gathered here move in different directions depending on the window, the indicator and the route by which information reaches people. Rather than rank the sources against each other, the points below are set down as observations.
Read together, the three observations describe a period in which the recorded figures and the survey responses move apart. The divergence sits alongside a shift in the composition of crime statistics and in the routes by which crime information reaches people. Whether Japan has become less safe depends on the indicator, the window and the source, and that dependence is itself the clearest description of the present picture.
Frequently Asked Questions
When reading safety figures, check three things together: the window, the indicator and the route the information travelled. The same data supports different readings once any of the three changes.
Q1. Why do the recorded figures and public perception differ so much?
The survey responses track how much crime information people encounter rather than the number of offenses recorded. In the 2025 Public Opinion Survey on Public Safety, 76.4% of those who said safety had worsened cited television and newspaper coverage and 61.1% cited online news, while 14.2% cited being a victim personally or in their family. Exposure to coverage can change quickly with editorial attention.
Q2. Does a high rate per 1,000 people mean a prefecture is unsafe?
Not on its own. In the 2024 final figures, Osaka Prefecture was highest at 9.30 per 1,000 and Akita Prefecture lowest at 2.83. Most of the higher-ranked prefectures are metropolitan, with large entertainment districts, heavy footfall and large daytime populations. The lower-ranked ones tend to be less densely populated. The measure reflects population structure and urban form rather than a ranking of policing.
Q3. Does 2025 passing the pre-COVID level mean safety has worsened?
It depends on the window. At 774,142, the 2025 total is about 3.4% above the 2019 level of 748,559 and marks a fourth consecutive annual rise, so over the short run the series has moved past a simple rebound. Against the 2002 peak of 2,853,739 it remains about 73% lower. Both statements hold at the same time.
🔍 About the Fact-Check for This Article
Japan in Data fact-checks its articles. The evidence used for this page is listed below.