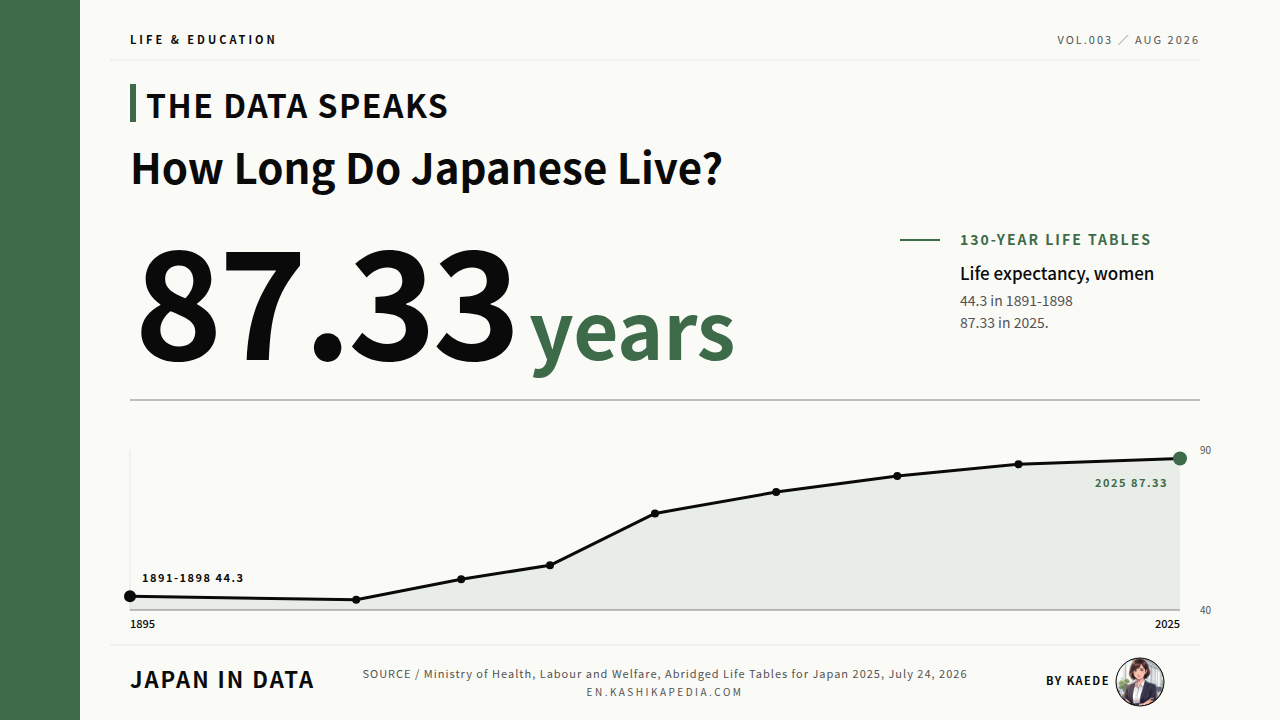

A life expectancy figure is easier to read once you put the current year and the first year of the record side by side. Japan has kept life tables since the 1890s, so the whole span can be drawn as one line.
A newborn girl in Japan can expect 87.33 years of life and a newborn boy 81.35 years, according to the abridged life tables the Ministry of Health, Labour and Welfare published on July 24, 2026. In the first Japanese life table, covering 1891 to 1898, the same two figures were 44.3 and 42.8 years. Female life expectancy has roughly doubled across the length of the record.
This article follows that record from the first life table to the 2025 tables, using the ministry’s own series. It sets out the year each ten-year threshold was passed, the share of each life-table cohort that reaches 65, 75 and 90, the changing gap between women and men, and where the 2025 figures sit in the ministry’s international comparison table.
How long does Japan’s life table say a newborn girl will live?
87.33 years in 2025, against 44.3 years in the first table of 1891 to 1898.
This article was researched and edited by Kaede, Data Editor, Japan in Data. Figures are current as of publication. Statistics and definitions are revised from time to time, so please check the official sources for the latest values.
- From 44.3 Years to 87.33: the Full 130-Year Record
- Each Extra Decade Has Taken Longer Than the One Before
- What the 2025 Table Says About Reaching 65, 75 and 90
- The Gap Between Women and Men Peaked in 2005
- Where the 2025 Figures Sit in the International Comparison
- Kaede’s Summary: a Long Record That Is Now Moving Slowly
- Frequently Asked Questions
- 🔍 About the Fact-Check for This Article
From 44.3 Years to 87.33: the Full 130-Year Record
The whole record fits on one chart if the pre-war complete tables are drawn as dots and the post-war annual series as a line. The step at 1947 is easy to miss when only the recent decades are quoted.
*Compiled and edited by the Japan in Data editorial team based on official government statistics.
The first Japanese life table covers the years 1891 to 1898 and puts life expectancy at birth at 42.8 years for men and 44.3 years for women. For the next four decades the figures moved very little. The 1921 to 1925 table records 42.06 years for men, below the level of the first table.
The 1935 to 1936 table is the last before the war, at 46.92 years for men and 49.63 for women. The next table covers 1947, and it is the first to place both sexes above 50 years, at 50.06 and 53.96. No annual figures exist for the years between, which is why the chart carries a gap there.
From 1947 the ministry has published an unbroken annual series. Between 1947 and 2025 male life expectancy rose by 31.29 years and female life expectancy by 33.37 years. Most of that movement belongs to the first three post-war decades. Since 2000 the annual changes have been measured in tenths of a year rather than whole years.
The series is not monotonic. Male life expectancy has fallen in 12 separate years since 1975, most recently in 2021 and 2022. The 2022 figure of 81.05 years was the lowest since 2016. The 2025 figures of 81.35 and 87.33 years are 0.25 and 0.20 years above 2024, and both remain below the 2020 peaks of 81.56 and 87.71 years.
Each Extra Decade Has Taken Longer Than the One Before
Instead of reading the line, mark the year each ten-year threshold was first passed. The intervals between those marks are the part of the story that a smooth curve hides.
*Compiled and edited by the Japan in Data editorial team based on official government statistics.
The complete life tables record the crossings precisely. Male life expectancy passed 50 years in the 1947 table, 60 years in the 1955 table, 70 years in the 1975 table and 80 years in the 2015 table. The intervals between those four crossings are 8 years, 20 years and 40 years.
Each additional decade of male life expectancy has taken at least twice as long to reach as the decade before it. Female life expectancy shows the same shape at an earlier date. It passed 60 years in the 1950 to 1952 table, 70 years in the 1960 table and 80 years in the 1985 table, so the last of those steps took 25 years.
As of the 2025 abridged table, neither sex has reached the next threshold. Female life expectancy stands 2.67 years below 90 and male life expectancy 8.65 years below 90. The ministry publishes these tables as a summary of one year’s mortality and does not attach a projection to them.
What the 2025 Table Says About Reaching 65, 75 and 90
Life expectancy is one number standing in for a whole distribution. The share of the life-table cohort still alive at each age says more about what changed, so I have put 1947 and 2025 next to each other.
*Compiled and edited by the Japan in Data editorial team based on official government statistics.
The life table follows a notional 100,000 births through the death rates of a single year. In the 2025 table, 89,892 of the 100,000 male births are still alive at 65 and 94,533 of the female births, which the ministry reports as 89.9 and 94.5 per cent.
At 75 the shares are 76.0 per cent for men and 88.1 per cent for women. At 90 they are 26.7 and 50.8 per cent. Half of the female cohort in the 2025 table is still alive at 90, a threshold the female share crossed for the first time in the 2020 table at 52.6 per cent.
The 1947 table gives the scale of the change. There, 39.8 per cent of men and 49.1 per cent of women reached 65, 18.5 and 29.0 per cent reached 75, and 0.9 and 2.0 per cent reached 90. The female share reaching 90 is 25.4 times the 1947 figure and the male share 29.7 times.
One further figure sits alongside life expectancy. The median lifespan, the age by which half the life-table cohort is expected to have died, is 84.13 years for men and 90.17 years for women in 2025. Both exceed life expectancy at birth, by 2.78 and 2.84 years, because early deaths pull the average below the middle of the distribution.
The Gap Between Women and Men Peaked in 2005
The difference between the two lines has its own history. It is one of the few series in this article that has moved in both directions.
*Compiled and edited by the Japan in Data editorial team based on official government statistics.
In the 1947 table the difference between female and male life expectancy was 3.90 years. It widened almost without interruption for six decades, reaching 6.47 years in 1995 and 6.96 years in 2005, the widest figure in the series.
Since 2005 the gap has narrowed in most years, and the 2025 figure of 5.98 years is the same as the 1990 figure. The 2025 gap is 0.05 years narrower than in 2024. It remains 2.08 years wider than in 1947.
The ministry also decomposes the year-on-year change by cause of death. According to that analysis, changes in mortality from malignant neoplasms, heart disease and COVID-19 worked to lengthen life expectancy in 2025 for both sexes, while changes in mortality from pneumonia and senility worked to shorten it. For men the cancer contribution was 0.10 years and the COVID-19 contribution 0.08 years.
Where the 2025 Figures Sit in the International Comparison
The ministry publishes its own top-ten list with a warning attached, so this chart reproduces both the ranking and the warning.
*Compiled and edited by the Japan in Data editorial team based on official government statistics.
In the ministry’s comparison, Japan holds first place for women at 87.33 years, ahead of the Republic of Korea at 86.6 and Spain at 86.53. For men Japan is seventh at 81.35 years, behind Sweden at 82.52, Switzerland at 82.4, Italy at 81.744, Norway at 81.61, Cyprus at 81.44 and Spain at 81.38.
The ranking places Japanese women first and Japanese men seventh in the same table. The ministry states that reference periods and compilation methods differ between countries, so a strict comparison is difficult. The Japanese figures are for 2025 while several others are for 2024 or a multi-year period.
The same document lists Hong Kong separately as a reference entry rather than a country, at 83.27 years for men and 88.73 for women. Among the entries the ministry treats as countries, the female figures from first to tenth place span 2.23 years and the male figures span 1.62 years.
Kaede’s Summary: a Long Record That Is Now Moving Slowly
Three things are worth carrying away from these five charts, and one of them is about how the number is built rather than what it says.
Across the length of the Japanese record, life expectancy at birth has risen by 43.03 years for women and 38.55 years for men. Spread over the 130 years between the mid-point of the 1891 to 1898 table and 2025, that is close to 4.0 months added per calendar year for women and 3.6 months for men.
The pace within that span has not been even. The eight years between the male 50-year and 60-year crossings became 20 years for the next decade and 40 years for the one after. The annual changes recorded since 2000 are measured in tenths of a year, and the male figure fell in two of the last five years.
The third point concerns the measure itself. A life table describes one year of mortality applied to a notional cohort, so the 2025 figures are a summary of 2025 rather than a statement about anyone’s lifetime. The share of the cohort reaching 90 and the median lifespan describe the same year from a different angle.
Frequently Asked Questions
These three questions come up most often when a life expectancy figure is quoted outside Japan, and all three are answered directly in the ministry’s own notes.
Q1. Does 87.33 years mean most Japanese women die at about 87?
Not quite. Life expectancy at birth is an average of a distribution, and the average is pulled down by deaths at younger ages. The ministry also publishes a median lifespan, the age by which half of the life-table cohort is expected to have died. For 2025 it is 90.17 years for women and 84.13 years for men, each above the corresponding life expectancy at birth.
Q2. Why are the early Japanese figures given as ranges of years?
The complete life tables were compiled from census populations and death registrations, and the earliest ones pooled several years to obtain enough events for stable rates. The first table covers 1891 to 1898, the second 1899 to 1903, and so on. The ministry also notes that the earlier post-war figures exclude Okinawa, which was not under Japanese administration at the time.
Q3. What is the difference between the abridged and the complete life tables?
The abridged tables are produced every year from population estimates and the monthly vital statistics report, and they give values at selected ages. The complete tables are produced every five years from confirmed census populations and confirmed vital statistics, and they give values at every single year of age. The 2025 figures in this article come from the abridged series and the pre-1947 figures from the complete series.
🔍 About the Fact-Check for This Article
Japan in Data fact-checks its articles. The evidence used for this page is set out below.