
The short answer depends on which official measure you pick up. One set of figures puts Japan below the United States. Another set, built for comparison across countries, puts Japan well above Germany. Let us look at both.
Workers in Japan put in an average of 1,617 hours in 2024. The same table gives 1,796 hours for the United States, 1,865 for Korea and 1,331 for Germany. On that measure Japan sits eighth out of the seventeen countries listed, closer to the middle of the group than to the top.
A second measure reads differently. Counting the share of workers who put in 49 hours or more in a week, Japan records 14.2%, against 11.4% in the United States and 4.4% in Germany. The two measures are built for different jobs, and this article sets them side by side.
The figures come from the Databook of International Labour Statistics 2026, published by the Japan Institute for Labour Policy and Training, and from the Monthly Labour Survey run by the Ministry of Health, Labour and Welfare. Both draw on the underlying OECD, ILOSTAT and Japanese government series.
Japan produces two separate official pictures of working time. The Monthly Labour Survey, run by the Ministry of Health, Labour and Welfare, asks establishments how many hours their employees actually worked, and reports full-time and part-time employees separately. The Labour Force Survey, run by the Statistics Bureau, asks households how many hours each person worked in a given week, and feeds the internationally harmonised figures. The two surveys use different populations, so their numbers are not interchangeable.
Do people in Japan really work longer hours than people elsewhere?
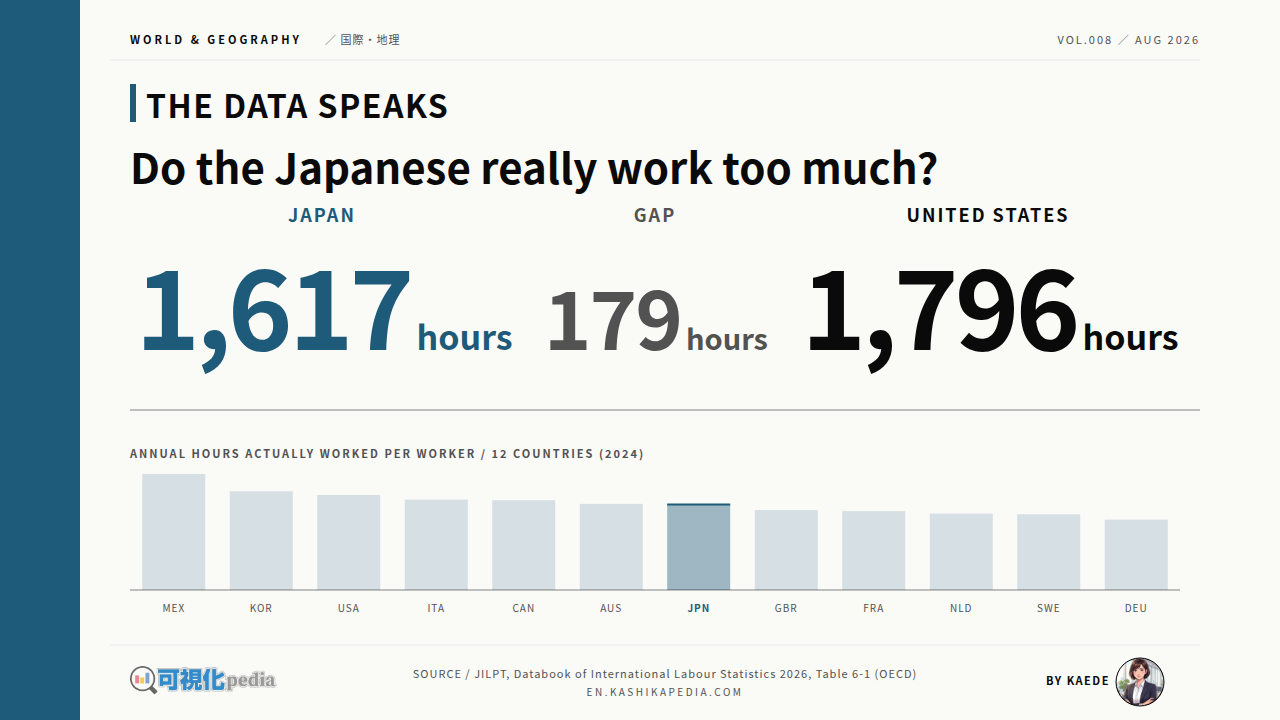
On average annual hours, Japan recorded 1,617 in 2024, below the 1,796 of the United States.
Japan is179 hoursbelow the United States (1,796 minus 1,617)
Researched and edited by Kaede, Data Editor, Japan in Data. Based in Saitama, Japan. Figures are current as of the date of writing. Statistics, rules and services change, so please check the official sources for the latest position.
- How Many Hours Does the Average Worker in Japan Put In?
- Japan’s Annual Hours Fell by 476 Since 1985
- The Average Counts Part-Time Employees Too
- On the Harmonised Measure, 14.2% Work 49 Hours or More
- Days Off and Paid Leave: Japan at 136.1 Days
- How to Read These Figures: Three Things to Keep in Mind
- Kaede’s Summary: Two Measures, Two Different Answers
- Frequently Asked Questions
- 🔍 About the Fact-Check for This Article
How Many Hours Does the Average Worker in Japan Put In?
Let us start with the figure that appears in most international comparisons: average annual hours actually worked, covering everyone in employment.
* Compiled and edited by the Japan in Data editorial team based on official government statistics.
Mexico leads the listed countries at 2,193 hours, followed by Korea at 1,865 and the United States at 1,796. Japan records 1,617, between Australia at 1,627 and the United Kingdom at 1,512. Germany sits at the bottom of the list with 1,331 hours, some 862 hours below Mexico.
The measure divides total hours worked in a year by the average number of people in employment. It takes in full-time staff, part-time staff and the self-employed, and it counts paid and unpaid overtime while leaving out holidays, paid leave and sick days.
The compiling body attaches a warning to the table. Because countries collect and calculate these hours in different ways, the figures are built for following one country over time, not for ranking levels between countries in a single year. The ordering above is worth reading with that note in hand.
Japan’s Annual Hours Fell by 476 Since 1985
The same table runs back to 1985, which is the use the compilers intend. Here is how Japan moved, with three other countries for reference.
* Compiled and edited by the Japan in Data editorial team based on official government statistics.
Japan recorded 2,093 hours in 1985 and 1,617 in 2024, a fall of 476 hours. The steepest part of the decline runs through the late 1980s and the 1990s, the years around the revision of the Labour Standards Act that moved the statutory week to 40 hours.
The line reaches its lowest point at 1,597 hours in 2020, then settles between 1,597 and 1,617 in the four years since. Japan crossed below the United States around 1995 and has stayed below it ever since. Germany and France start lower and drift lower still.
The Average Counts Part-Time Employees Too
An average moves when the mix of people inside it changes. Japan reports full-time and part-time employees separately, so we can look inside the number.
* Compiled and edited by the Japan in Data editorial team based on official government statistics.
The Monthly Labour Survey put all employees at 1,621 hours in 2025. Splitting that figure, full-time employees worked 1,926 hours and part-time employees 949 hours. The full-time figure sits 305 hours above the headline average, roughly the difference between the headline number and the United States.
The mix has shifted over the period. Part-time employees made up 12.97% of all regular employees in 1990 and 31.31% in 2025, a rise of 18.34 percentage points. A growing share of shorter schedules pulls the overall average down even when individual schedules hold steady.
The survey’s own index series shows the same split. Between 1993 and 2025 total hours for all employees fell by 15.4%, while hours for full-time employees fell by 6.7%. Annual hours for all regular employees went from 2,064 in 1990 to 1,621 in 2025, and attendance days from 257 to 209.
On the Harmonised Measure, 14.2% Work 49 Hours or More
There is a measure designed for cross-country comparison. It counts how many workers cross one common weekly threshold, so the levels can sit side by side.
* Compiled and edited by the Japan in Data editorial team based on official government statistics.
Mexico records 25.4% and Korea 15.0%. Japan follows at 14.2%, then the United States at 11.4% and the United Kingdom at 8.9%. Germany records 4.4% and the Netherlands 5.1%. Japan sits about 3.2 times above Germany on this measure, and above the United States, reversing the order seen in annual hours.
Within Japan the figure splits sharply by sex. It stands at 20.4% for men and 6.7% for women, a gap of about three times. The share has also fallen over time, from 23.1% in 2010 to 14.2% in 2024, a drop of 8.9 percentage points.
Statutory limits sit alongside these numbers. Since the 2019 revision, overtime in Japan is capped at 45 hours a month and 360 hours a year by default, with an exceptional ceiling of 720 hours a year, under 100 hours in any single month and an average of 80 hours over any two to six months.
Days Off and Paid Leave: Japan at 136.1 Days
Hours are one side of the ledger. Days away from work are the other, and the same source sets Japan against three European countries.
* Compiled and edited by the Japan in Data editorial team based on official government statistics.
Japan totalled 136.1 days off in 2024, made up of 104 weekly rest days, 14 public and other holidays and 18.1 days of paid leave granted. Germany reaches 142 days, France 140 and Italy 139, all on 2022 readings. The totals sit within six days of each other.
The composition differs more than the total. Japan reports 18.1 days of paid leave granted, against 30 days in Germany and 25 in France and Italy, and makes up much of the difference with public holidays. Of the 18.1 days granted in Japan, 12.1 days were taken, a take-up rate of 66.9%.
How to Read These Figures: Three Things to Keep in Mind
Before drawing conclusions, three properties of the data are worth holding on to.
First, the two measures answer different questions. Average annual hours describe the middle of the distribution and are shaped by who is counted. The 49-hour share describes the tail and is unaffected by how many short schedules sit below it.
Second, the surveys behind them differ. The annual hours series for Japan rests on establishment reporting, while the long-hours share rests on the household-based Labour Force Survey. The same country can therefore appear at different points depending on which instrument is used.
Third, hours actually worked exclude paid leave, so a country where leave goes untaken records more worked hours for the same contract. A take-up rate of 66.9% means about a third of granted leave in Japan stays unused, and those days are counted as worked time in the annual totals.
Kaede’s Summary: Two Measures, Two Different Answers
The question that opened this article does not resolve into one number. It resolves into a choice of measure, and both measures are official.
Asked whether people in Japan work too much, the annual hours series and the long-hours share point in opposite directions. Rather than picking one, it seems more useful to record what each one covers and where they disagree.
Read together, the three observations suggest a shape rather than a verdict. The Japanese average has come down a long way, while the share of people working very long weeks remains high by European standards. Both statements rest on official figures, and both belong in the answer.
Frequently Asked Questions
Three questions come up often about these figures. They are mostly about definitions and about what the numbers can carry.
Q1. Why is Japan below the United States on annual hours?
The measure divides total hours by everyone in employment, and about 31% of regular employees in Japan work part-time schedules. Counting full-time employees on their own gives 1,926 hours for 2025, against a headline 1,621. The United States figure of 1,796 covers its own mix, which is why the compilers advise against reading single-year levels as a ranking.
Q2. What counts as long hours in these statistics?
The comparison table uses 49 hours or more in a week, the longest band shared by all the countries covered. It is a statistical threshold rather than a legal one. Japanese law sets a 40-hour week, with overtime permitted under a labour-management agreement and capped at 45 hours a month and 360 hours a year by default.
Q3. Does the term karoshi appear in these figures?
Not directly. Karoshi refers to death from overwork and is tracked through separate compensation and prevention statistics, not through the hours tables used here. The 49-hour share is the closest indicator in this article, because it measures how many people sit in the long-hours tail rather than where the average falls.
🔍 About the Fact-Check for This Article
Japan in Data fact-checks its articles. The evidence used on this page is set out below.