
Japan counts its hot springs by source, not by bathhouse. Once you know that, the prefecture ranking becomes easy to read, and a few of the results are not the ones most travel guides would lead you to expect.
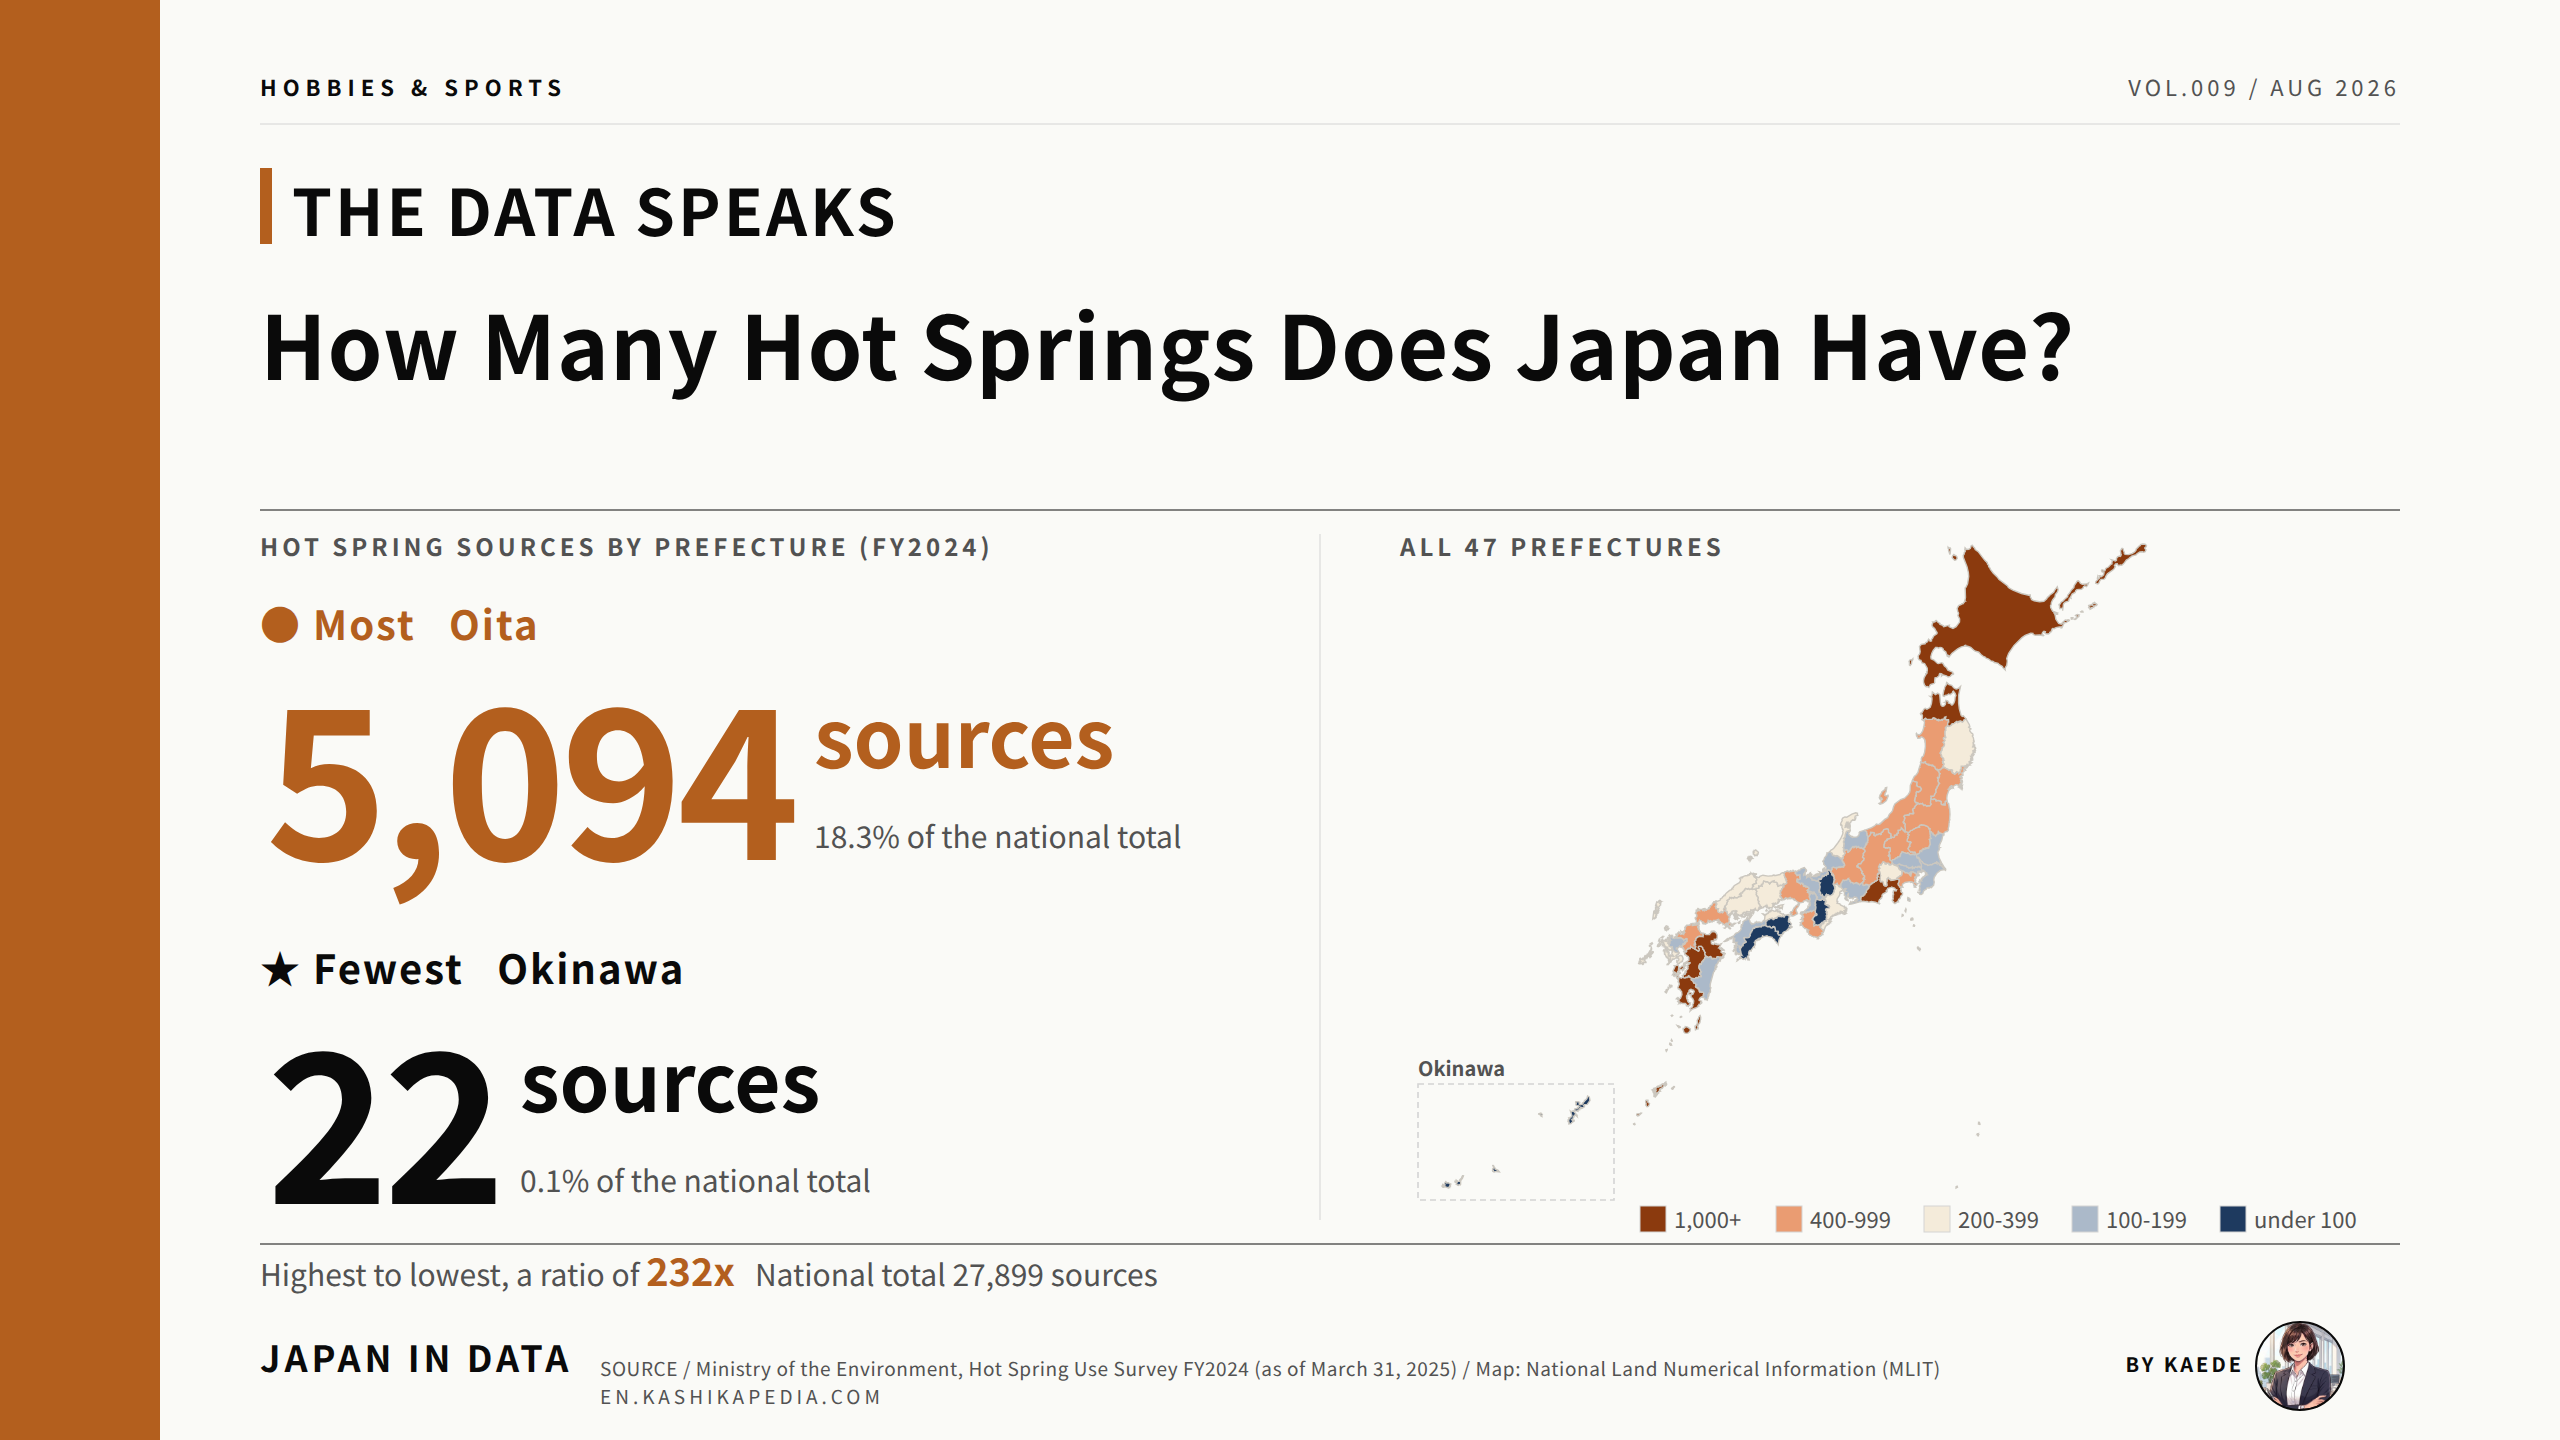
Japan had 27,899 hot spring sources as of March 31, 2025, spread across 2,839 hot spring resort towns. Oita Prefecture holds 5,094 of those sources, 18.3 percent of the national total and more than any other prefecture. Okinawa holds 22, the fewest. The gap between the highest and the lowest prefecture is about 232 times.
This article uses the Ministry of the Environment’s Hot Spring Use Survey for FY2024, which reports source counts, resort towns, lodgings and overnight guests for all 47 prefectures. Japan in Data has recalculated every national total from the prefecture rows, and has combined the source counts with land area published by the Geospatial Information Authority of Japan to produce the density figures.
How many hot spring sources does Japan have?
27,899 as of March 31, 2025. Oita Prefecture alone holds 5,094 of them.
This article is researched and edited by Kaede. Figures are current as of the date of writing. Statistics, rules and services can change, so please check the official sources for the latest position.
- Oita Has 5,094 Sources, Okinawa Has 22 | All 47 Prefectures Mapped
- All 47 Prefectures Ranked | Switch by Region
- Counting Sources or Counting Density | Hokkaido Drops from 3rd to 38th
- Where the Sources Are Is Not Where People Stay | Hokkaido and Gunma
- Japan’s Source Count Peaked in FY2006 | Resort Towns Keep Falling
- How to Read These Numbers | Three Assumptions Behind the Ranking
- Kaede’s Summary | Read the Unit Before You Read the Rank
- Frequently Asked Questions
- About the Fact-Check for This Article
Oita Has 5,094 Sources, Okinawa Has 22 | All 47 Prefectures Mapped
The tile map below places all 47 prefectures in roughly their real positions. Darker brown means more sources, dark navy means fewest. Let us start with the whole country.
*Compiled and edited by the Japan in Data editorial team based on official government statistics.
Oita Prefecture, on the northeast coast of Kyushu, recorded 5,094 sources, ahead of Kagoshima with 2,735 and Hokkaido with 2,249. Shizuoka follows with 2,185 and Kumamoto with 1,339. The five largest prefectures together hold 48.8 percent of every source in Japan. Kyushu and Okinawa combined account for 10,201 sources, or 36.6 percent.
At the other end, Okinawa recorded 22 sources, Nara 77, Tokushima 82, Shiga 86 and Kochi 96. These five are the only prefectures below 100. The national average works out at 594 sources per prefecture, a figure that only nine prefectures exceed, which shows how far the distribution is pulled by the volcanic south and north.
All 47 Prefectures Ranked | Switch by Region
If you want to check a particular prefecture, the table below carries all 47 rows. Switching to a regional tab filters the view, but every prefecture stays on the page.
The table lists prefectures from most sources to fewest. Alongside the raw count it shows sources per 1,000 square kilometres of land area and the rank on that measure, so the two orderings can be compared row by row. The number of resort towns is listed separately, because a prefecture with many sources does not always have many towns.
All 47 prefectures by number of hot spring sources (FY2024). Ranks are national.
| Rank | Prefecture | Sources | Per 1,000 km2 | Density rank | Resort towns |
|---|---|---|---|---|---|
| 1 | Oita | 5,094 | 803.4 | 1 | 63 |
| 2 | Kagoshima | 2,735 | 297.7 | 2 | 87 |
| 3 | Hokkaido | 2,249 | 27.0 | 38 | 226 |
| 4 | Shizuoka | 2,185 | 281.0 | 3 | 118 |
| 5 | Kumamoto | 1,339 | 180.7 | 5 | 55 |
| 6 | Aomori | 1,089 | 112.9 | 6 | 120 |
| 7 | Nagano | 955 | 70.4 | 18 | 193 |
| 8 | Fukushima | 799 | 58.0 | 21 | 122 |
| 9 | Miyagi | 740 | 101.6 | 10 | 39 |
| 10 | Tochigi | 633 | 98.8 | 11 | 66 |
| 11 | Akita | 616 | 52.9 | 22 | 104 |
| 12 | Kanagawa | 602 | 249.1 | 4 | 36 |
| 13 | Niigata | 536 | 42.6 | 28 | 135 |
| 14 | Gifu | 506 | 47.6 | 25 | 55 |
| 15 | Wakayama | 506 | 107.1 | 7 | 50 |
| 16 | Gunma | 459 | 72.1 | 17 | 98 |
| 17 | Hyogo | 443 | 52.7 | 23 | 78 |
| 18 | Fukuoka | 422 | 84.6 | 13 | 46 |
| 19 | Yamagata | 412 | 44.2 | 26 | 67 |
| 20 | Yamaguchi | 404 | 66.1 | 20 | 40 |
| 21 | Iwate | 393 | 25.7 | 41 | 81 |
| 22 | Hiroshima | 374 | 44.1 | 27 | 56 |
| 23 | Tottori | 363 | 103.5 | 9 | 15 |
| 24 | Ishikawa | 330 | 78.7 | 14 | 48 |
| 25 | Yamanashi | 304 | 68.1 | 19 | 29 |
| 26 | Shimane | 267 | 39.8 | 29 | 41 |
| 27 | Okayama | 221 | 31.1 | 35 | 32 |
| 28 | Mie | 214 | 37.1 | 32 | 74 |
| 29 | Nagasaki | 203 | 49.1 | 24 | 37 |
| 30 | Kagawa | 200 | 106.6 | 8 | 28 |
| 31 | Miyazaki | 199 | 25.7 | 40 | 29 |
| 32 | Ehime | 192 | 33.8 | 33 | 37 |
| 33 | Saga | 187 | 76.6 | 15 | 21 |
| 34 | Osaka | 173 | 90.8 | 12 | 17 |
| 35 | Toyama | 169 | 39.8 | 30 | 61 |
| 36 | Tokyo | 168 | 76.4 | 16 | 22 |
| 37 | Fukui | 158 | 37.7 | 31 | 38 |
| 38 | Ibaraki | 157 | 25.7 | 39 | 39 |
| 39 | Kyoto | 146 | 31.7 | 34 | 37 |
| 40 | Chiba | 144 | 27.9 | 37 | 95 |
| 41 | Aichi | 133 | 25.7 | 42 | 35 |
| 42 | Saitama | 117 | 30.8 | 36 | 31 |
| 43 | Kochi | 96 | 13.5 | 46 | 37 |
| 44 | Shiga | 86 | 21.4 | 43 | 27 |
| 45 | Tokushima | 82 | 19.8 | 45 | 25 |
| 46 | Nara | 77 | 20.9 | 44 | 34 |
| 47 | Okinawa | 22 | 9.6 | 47 | 15 |
| Rank | Prefecture | Sources | Per 1,000 km2 | Density rank | Resort towns |
|---|---|---|---|---|---|
| 3 | Hokkaido | 2,249 | 27.0 | 38 | 226 |
| 6 | Aomori | 1,089 | 112.9 | 6 | 120 |
| 8 | Fukushima | 799 | 58.0 | 21 | 122 |
| 9 | Miyagi | 740 | 101.6 | 10 | 39 |
| 11 | Akita | 616 | 52.9 | 22 | 104 |
| 19 | Yamagata | 412 | 44.2 | 26 | 67 |
| 21 | Iwate | 393 | 25.7 | 41 | 81 |
| Rank | Prefecture | Sources | Per 1,000 km2 | Density rank | Resort towns |
|---|---|---|---|---|---|
| 10 | Tochigi | 633 | 98.8 | 11 | 66 |
| 12 | Kanagawa | 602 | 249.1 | 4 | 36 |
| 16 | Gunma | 459 | 72.1 | 17 | 98 |
| 36 | Tokyo | 168 | 76.4 | 16 | 22 |
| 38 | Ibaraki | 157 | 25.7 | 39 | 39 |
| 40 | Chiba | 144 | 27.9 | 37 | 95 |
| 42 | Saitama | 117 | 30.8 | 36 | 31 |
| Rank | Prefecture | Sources | Per 1,000 km2 | Density rank | Resort towns |
|---|---|---|---|---|---|
| 4 | Shizuoka | 2,185 | 281.0 | 3 | 118 |
| 7 | Nagano | 955 | 70.4 | 18 | 193 |
| 13 | Niigata | 536 | 42.6 | 28 | 135 |
| 14 | Gifu | 506 | 47.6 | 25 | 55 |
| 24 | Ishikawa | 330 | 78.7 | 14 | 48 |
| 25 | Yamanashi | 304 | 68.1 | 19 | 29 |
| 35 | Toyama | 169 | 39.8 | 30 | 61 |
| 37 | Fukui | 158 | 37.7 | 31 | 38 |
| 41 | Aichi | 133 | 25.7 | 42 | 35 |
| Rank | Prefecture | Sources | Per 1,000 km2 | Density rank | Resort towns |
|---|---|---|---|---|---|
| 15 | Wakayama | 506 | 107.1 | 7 | 50 |
| 17 | Hyogo | 443 | 52.7 | 23 | 78 |
| 28 | Mie | 214 | 37.1 | 32 | 74 |
| 34 | Osaka | 173 | 90.8 | 12 | 17 |
| 39 | Kyoto | 146 | 31.7 | 34 | 37 |
| 44 | Shiga | 86 | 21.4 | 43 | 27 |
| 46 | Nara | 77 | 20.9 | 44 | 34 |
| Rank | Prefecture | Sources | Per 1,000 km2 | Density rank | Resort towns |
|---|---|---|---|---|---|
| 20 | Yamaguchi | 404 | 66.1 | 20 | 40 |
| 22 | Hiroshima | 374 | 44.1 | 27 | 56 |
| 23 | Tottori | 363 | 103.5 | 9 | 15 |
| 26 | Shimane | 267 | 39.8 | 29 | 41 |
| 27 | Okayama | 221 | 31.1 | 35 | 32 |
| 30 | Kagawa | 200 | 106.6 | 8 | 28 |
| 32 | Ehime | 192 | 33.8 | 33 | 37 |
| 43 | Kochi | 96 | 13.5 | 46 | 37 |
| 45 | Tokushima | 82 | 19.8 | 45 | 25 |
| Rank | Prefecture | Sources | Per 1,000 km2 | Density rank | Resort towns |
|---|---|---|---|---|---|
| 1 | Oita | 5,094 | 803.4 | 1 | 63 |
| 2 | Kagoshima | 2,735 | 297.7 | 2 | 87 |
| 5 | Kumamoto | 1,339 | 180.7 | 5 | 55 |
| 18 | Fukuoka | 422 | 84.6 | 13 | 46 |
| 29 | Nagasaki | 203 | 49.1 | 24 | 37 |
| 31 | Miyazaki | 199 | 25.7 | 40 | 29 |
| 33 | Saga | 187 | 76.6 | 15 | 21 |
| 47 | Okinawa | 22 | 9.6 | 47 | 15 |
*Compiled and edited by the Japan in Data editorial team based on official government statistics.
Oita is first on both measures, with 803.4 sources per 1,000 square kilometres against a national figure of 73.8. Hokkaido shows the widest split in the table: third by count, 38th by density. Nagano, which has the most resort towns after Hokkaido, sits seventh by count and 18th by density.
Counting Sources or Counting Density | Hokkaido Drops from 3rd to 38th
A raw count rewards large prefectures. Dividing by land area asks a different question: how closely packed the sources are. Four prefectures show what changes.
*Compiled and edited by the Japan in Data editorial team based on official government statistics.
Hokkaido covers 83,422 square kilometres, more than a fifth of Japan, so its 2,249 sources work out at 27.0 per 1,000 square kilometres and it falls to 38th. Nagano moves from 7th to 18th for the same reason. Kanagawa moves the other way, from 12th by count to 4th by density, with 602 sources in 2,417 square kilometres.
Kagawa, the smallest prefecture at 1,877 square kilometres, rises from 30th by count to 8th by density with 200 sources. Oita holds first place on both measures. Neither ordering is more correct than the other: the count answers how many sources a prefecture contains, and the density answers how many sit within a given stretch of land.
Where the Sources Are Is Not Where People Stay | Hokkaido and Gunma
The survey also records how many overnight stays each prefecture’s hot spring lodgings took during the year. Placing that list beside the source ranking is where the two pictures separate.
*Compiled and edited by the Japan in Data editorial team based on official government statistics.
Hokkaido recorded 13,579,988 overnight stays, the most in the country, from third place in sources. Shizuoka is second on both lists. Gunma, home to the Kusatsu and Ikaho resorts, is 16th by sources but fourth by overnight stays, with 5,925,649. Chiba is 40th by sources and ninth by stays.
Oita, first by a wide margin in sources, is fifth by overnight stays with 5,495,869. Six prefectures appear in both top tens: Hokkaido, Shizuoka, Nagano, Tochigi, Oita and Fukushima. The survey does not record why visitors choose one prefecture over another, and the counts here describe stays rather than reasons.
Japan’s Source Count Peaked in FY2006 | Resort Towns Keep Falling
One long series gives the horizontal comparison its background. Watch the two panels separately: they do not move the same way.
*Compiled and edited by the Japan in Data editorial team based on official government statistics.
The count of sources rose from 13,079 in FY1962 to a peak of 28,154 in FY2006, a little more than double over 44 years. Since then it has moved within a narrow band and stood at 27,899 in FY2024, 0.9 percent below the FY2006 peak. The FY2024 figure is 21 lower than FY2023.
Resort towns follow a different line. They peaked at 3,185 in FY2010 and have fallen in almost every year since, reaching 2,839 in FY2024, a drop of 346 towns or 10.9 percent. Overnight stays fell to 76,592,711 in FY2020 and had recovered to 125,414,300 by FY2024, which is 12.4 percent below the FY1992 high of 143,246,266.
How to Read These Numbers | Three Assumptions Behind the Ranking
Before using the ranking, three points about how these figures are built. Knowing what the unit is keeps the reading steady.
*Compiled and edited by the Japan in Data editorial team based on official government statistics.
First, a source is not a bath. It is one point at which hot spring water emerges or is pumped, so a prefecture with many sources does not necessarily offer many places to bathe. Second, of the sources classified by use status, 11,032 were recorded as unused and 16,868 as in use, so roughly 40 percent of the counted sources were not being drawn on.
Third, the two datasets are measured on different dates. Source counts are as of March 31, 2025, while the land areas behind the density figures are as of July 1, 2025. The survey’s by-use-status columns sum to 27,900 against a published total of 27,899; the one-unit difference sits in the Toyama row, and this article uses the published total of 27,899 throughout.
Kaede’s Summary | Read the Unit Before You Read the Rank
Four figures, one map and one long series. Here are the three observations worth carrying away, rather than the rank order on its own.
The answer to how many hot spring sources Japan has is 27,899. That single number is a snapshot taken on one date, using one definition of what counts. Which prefecture leads depends on whether the question is about totals, density or visitors, so the observations below are set out separately.
Put together, the three observations point to a reading rather than a ranking. The count, the density and the visitor numbers each place a different prefecture at the top, and the unit being counted is a source rather than a bath or a town. Holding those two things in mind makes the same table usable for other years, and for the municipal-level figures that individual prefectures publish.
Frequently Asked Questions
Three questions come up most often about these figures. They are mainly about the unit being counted and how the density was worked out.
Q1. Does 27,899 mean there are 27,899 places to bathe in Japan?
No. The figure counts sources, meaning points at which hot spring water emerges or is pumped, not bathing facilities. The same survey separately records 2,839 resort towns, 13,425 lodgings that use hot spring water, and 7,721 public bathhouses that use it. Of the sources classified by use status, about 40 percent were recorded as unused, so sources sit well above the number of places open to bathers.
Q2. How were the per-area figures calculated?
Japan in Data divided each prefecture’s source count by its land area and multiplied by 1,000. For Oita that is 5,094 divided by 6,340.71 square kilometres, giving 803.4 per 1,000 square kilometres. Source counts come from the Ministry of the Environment as of March 31, 2025 and areas from the Geospatial Information Authority of Japan as of July 1, 2025, so the two are measured a few months apart.
Q3. Does a higher rank mean better hot springs?
The figures do not support that reading. They record how many sources a prefecture contains, not water quality, bath design, price or how easy a place is to reach. Water chemistry, temperature and setting vary widely between sources within a single prefecture. This article sets out counts and rankings as observations, without ranking prefectures as destinations.
About the Fact-Check for This Article
Japan in Data fact-checks its articles. The evidence used for this page is set out below.