
If you are planning a trip around the cherry blossoms, the first thing to settle is the date. The official record goes back to 1953, so we can answer that question with numbers rather than impressions.
When do Japan’s cherry blossoms bloom?
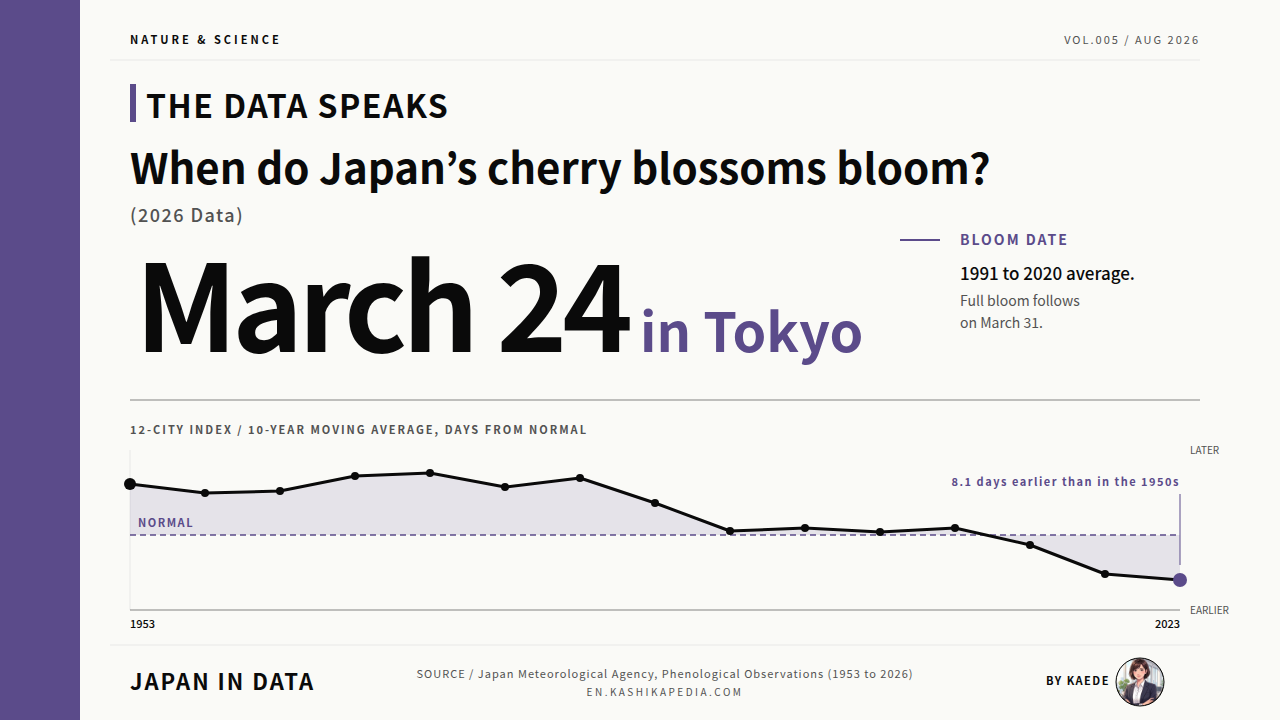
March 24 in Tokyo on the 30 year average. The front reaches northern Kyushu in late March and Hokkaido in early May.
This article is researched and edited by Kaede. Figures are current as of the date of writing. Statistics and definitions may be revised, so please check the official sources for the latest values.
Japan’s national weather service, the Japan Meteorological Agency, has recorded cherry blossom dates under a single national method since 1953. Each weather station watches one designated sample tree. First bloom is the day five or six flowers open on that tree, and full bloom is the day about 80 percent of the buds are open. Most stations observe somei-yoshino. Where that variety does not grow, Okinawa stations observe hikan-zakura and northern Hokkaido stations observe ezo-yamazakura.
- Tokyo blooms on March 24, and the front takes six weeks to cross Japan
- Full bloom follows first bloom by about a week
- The bloom date has moved 8 days earlier since the 1950s
- Decade averages fall from 5.7 days late to 4.8 days early
- Tokyo’s own record runs from April 11 to March 14
- All 12 cities moved in the same direction
- How these dates are recorded, and what changed in 2021
- Kaede’s summary: a firm date, and a slow drift
- Frequently Asked Questions
- About the Fact-Check for This Article
Tokyo blooms on March 24, and the front takes six weeks to cross Japan
The chart below shows, for each city, the average window between first bloom and full bloom. Reading it from the bottom up is the same as travelling from Okinawa to Hokkaido.
*Compiled and edited by the Japan in Data editorial team based on official government statistics.
The 1991 to 2020 averages place first bloom in Naha on January 16 and in Kushiro on May 16. Between those two ends, most of the main islands cluster tightly. Fukuoka opens on March 22, Tokyo and Nagoya on March 24, Kyoto on March 26 and Osaka on March 27.
North of Tokyo the dates spread out again. Kanazawa averages April 3, Sendai and Niigata April 8, Aomori April 22, Sapporo May 1. The whole sequence, from Fukuoka to Sapporo, takes about six weeks, which is why a single trip can catch the blossom twice if the itinerary moves north.
Naha and Kushiro sit outside the somei-yoshino range and observe different varieties, so their dates are not directly comparable with the rest. The agency notes this on every table.
Full bloom follows first bloom by about a week
Visitors often ask which of the two dates to aim for. The gap between them is short, and it is not the same everywhere.
*Compiled and edited by the Japan in Data editorial team based on official government statistics.
Across the 12 cities used in this article the average gap is 7.2 days. The agency describes the interval as roughly one week, and the station records match that description.
The gap is shortest in the north. Hakodate and Aomori average four days, Sapporo, Sendai and Niigata five. In the west it runs longer: nine days in Nagoya, Kyoto, Hiroshima and Fukuoka, and ten in Kumamoto and Kagoshima. In Tokyo it is seven days, from March 24 to March 31.
The bloom date has moved 8 days earlier since the 1950s
Now the longer view. I built a single index from 12 cities that all observe somei-yoshino and all have records running from 1953 to 2026.
*Compiled and edited by the Japan in Data editorial team based on official government statistics.
Each city is measured against its own 1991 to 2020 average, then the 12 differences are averaged. A value above the line means the blossom arrived later than the modern normal; a value below means earlier.
The first ten years of the record, 1953 to 1962, average 4.15 days later than normal. The most recent ten years, 2017 to 2026, average 3.90 days earlier. The distance between those two periods is 8.1 days.
Individual years still swing widely. 1984 came in 15.0 days late and 2021 came in 9.3 days early. The moving average is the part that has shifted, not the size of the year to year variation.
Decade averages fall from 5.7 days late to 4.8 days early
Grouping the same index by decade removes the year to year noise and leaves a plainer picture.
*Compiled and edited by the Japan in Data editorial team based on official government statistics.
The 1950s, 1960s, 1970s and 1980s all average between 4.1 and 5.7 days later than the modern normal. The 1990s fall to 0.8 days late, the 2000s to 0.1 days early and the 2010s to 0.8 days early.
The current period is the outlier in the series. The seven years from 2020 to 2026 average 4.8 days earlier than normal, which is a larger step than any single decade transition before it. Four of those seven years fall more than three days early.
Tokyo’s own record runs from April 11 to March 14
The 12 city index is an average, so it is worth looking at one station on its own. Tokyo has the record most visitors will recognise.
*Compiled and edited by the Japan in Data editorial team based on official government statistics.
The Tokyo sample tree stands at the meteorological station in the city centre, and the record is unbroken from 1953. The latest first bloom on file is April 11 in 1984. The earliest is March 14, reached in 2020 and matched in 2021.
Averaged over the first ten years the Tokyo date is March 27 or 28. Over the most recent ten years it is March 19. That is a shift of 8.3 days, close to the 12 city figure of 8.1. In 2026 Tokyo opened on March 19, five days before its normal date.
All 12 cities moved in the same direction
A national average can hide disagreement between places. In this record there is none to hide.
*Compiled and edited by the Japan in Data editorial team based on official government statistics.
Fitting a straight line to each city separately gives a rate of change per decade. Every one of the 12 is negative, meaning the date has moved earlier over the 74 years.
Hakodate has the steepest rate at 1.91 days per decade, followed by Aomori at 1.73 and Fukuoka at 1.67. Kagoshima has the shallowest at 0.57 and Kumamoto at 0.82. The 12 city index falls 1.4 days per decade, and the agency reports 1.1 days per decade for its own national series.
According to the Japan Meteorological Agency, the tendency for the first-bloom date to come earlier is considered to reflect the long-term rise in temperature during the season when these events occur.
How these dates are recorded, and what changed in 2021
Before drawing conclusions from any of this, it helps to know how the numbers are produced. Two details matter.
First, the observation is made on one designated tree per station, not on the surrounding city. First bloom is declared when five or six flowers have opened on that tree, and full bloom when about 80 percent of the buds are open. Well-known viewing spots can be a few days out of step with the station.
Second, the programme itself has changed. In January 2020 the agency observed 34 plant species and 23 animal species at 58 stations. From January 2021 it narrowed to 6 species and 9 phenomena, keeping those best suited to tracking long-term change. The cherry blossom series was among those kept, so the record continues unbroken.
Elevation also matters. The agency notes that first bloom is generally delayed by roughly two to three days for every 100 metres of altitude, which is why mountain sites run behind the nearby city station.
Kaede’s summary: a firm date, and a slow drift
Four charts and one index later, here is what the record supports and what it does not.
The question this article started with has a plain answer. In Tokyo, the average first-bloom date is March 24 and full bloom is March 31. Further south, late March; further north, late April into May. That is the planning answer.
The second answer is slower and easier to miss. The dates that anchor a trip are not fixed points. They have moved by a little over a week across the length of the record, and the movement is in the same direction at every station examined here. Anyone using a 30 year average to plan a visit is using a figure that is already behind the most recent decade.
Frequently Asked Questions
Three questions come up most often about these dates. All three are about how to read the numbers rather than what they mean.
Q1. When is the best time to see cherry blossoms in Japan?
That depends on where you are going, and on whether you want first bloom or full bloom. Using the 1991 to 2020 averages, the window in Tokyo runs from March 24 to March 31, in Kyoto from March 26 to April 4, in Fukuoka from March 22 to March 31 and in Sapporo from May 1 to May 6.
Recent years have tended to run several days ahead of these averages. In 2026 the 12 city index came in 5.4 days early, so checking the agency’s current-season page before booking is worthwhile.
Q2. What exactly do first bloom and full bloom mean?
They are defined against a single sample tree at each weather station. First bloom is the first day five or six flowers are open on that tree. Full bloom is the first day about 80 percent of its buds are open. Neither term describes the surrounding park or riverbank, which may run a few days ahead or behind.
Q3. Are the 2026 dates final?
They are the values published in the agency’s tables at the time of writing, and they are used here as such. Phenological records can be revised. The 1991 to 2020 normals used for comparison throughout this article will also be replaced when the next 30 year averaging period is compiled.
About the Fact-Check for This Article
Japan in Data fact-checks its articles. The evidence behind the figures on this page is set out below.