
Two different kinds of number sit side by side in this article. One is a ranking compiled by a private firm. The other is a count kept by the Japanese government. Reading them together is the quickest way to see what the passport question is actually about.
Japan’s passport is one of the most widely accepted travel documents in the world. In the Henley Passport Index published in January 2026, it shares second place with South Korea, with visa-free access to 188 of the 227 destinations the index covers. Singapore ranks first with 192.
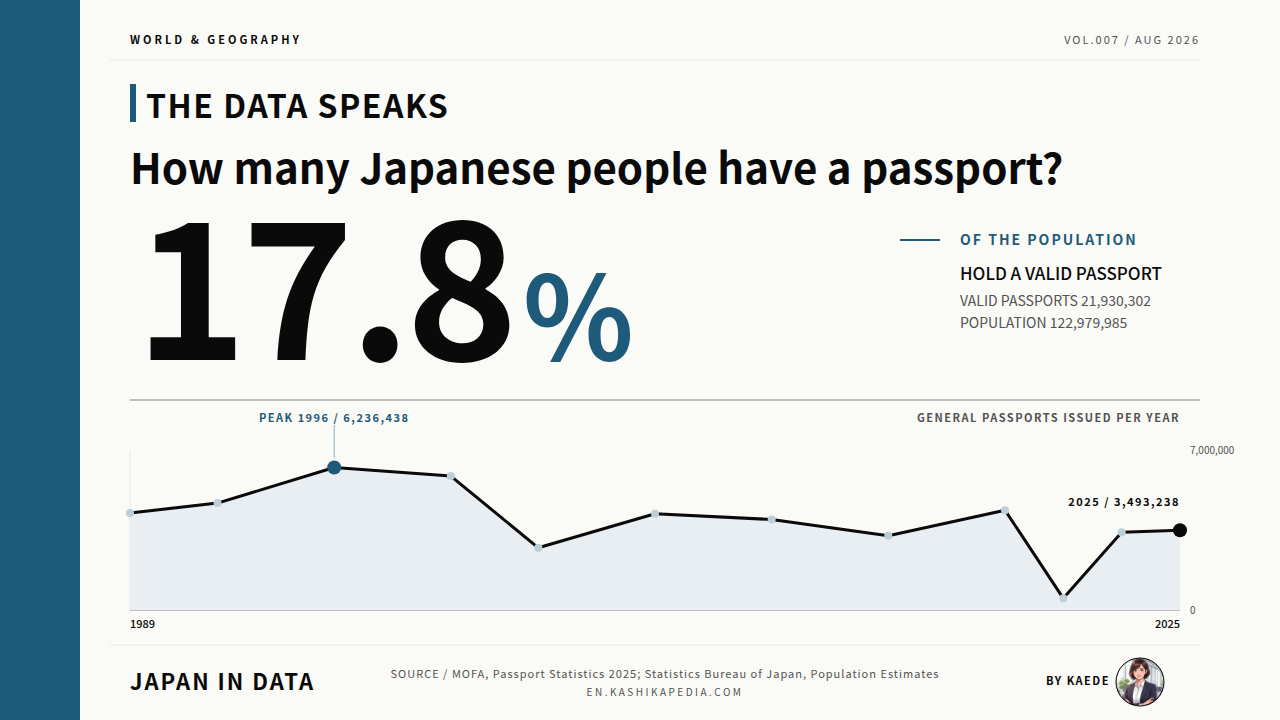
How many people actually hold one is a separate question. At the end of 2025 the Ministry of Foreign Affairs counted 21,930,302 valid ordinary passports issued inside Japan. Set against a population of 122,979,985 at the start of 2026, that comes to 17.8%, or about one person in every 5.6.
This article places four records side by side: the ranking, the holding rate, annual issuance since 1989, and departures by Japanese nationals since 1964. The figures come from the Ministry of Foreign Affairs, the Statistics Bureau of Japan and Henley & Partners. Definitions and limits are set out towards the end.
Japan issues two kinds of passport. Ordinary passports go to the general public, while official and diplomatic passports cover government business and are counted separately. Every figure below refers to ordinary passports. Passport statistics are compiled by the Ministry of Foreign Affairs on a calendar year basis, January to December, and published the following February. An ordinary passport is valid for either five or ten years, so the stock of valid passports reflects applications made across the previous decade rather than a single year.
How many people in Japan hold a passport?
17.8% at the end of 2025, while the passport itself ranks joint second in the world.
Researched and edited by Kaede, Data Editor, Japan in Data. Based in Saitama, Japan. Figures are current as of the date of writing. Statistics and administrative rules change over time, so please check the official sources for the latest values.
- Japan’s Passport Ranks Joint Second in the World in 2026
- 21.93 Million Valid Passports, or 17.8% of the Population
- Annual Issuance Peaked at 6.24 Million in 1996
- Departures Reached 14.73 Million in 2025, 73.4% of the 2019 Level
- Under-30s Accounted for 1.56 Million of the 2025 Applications
- How to Read These Figures: Five Points
- Kaede’s Summary: Broad Access, Held by Fewer Than One in Five
- Frequently Asked Questions
- 🔍 About the Fact-Check for This Article
Japan’s Passport Ranks Joint Second in the World in 2026
The ranking and the holding rate answer different questions. This first section covers only what the passport lets its holder do at a border.
The Henley Passport Index ranks 199 passports by the number of destinations their holders can enter without arranging a visa in advance. It draws on Timatic data from the International Air Transport Association and covers 227 destinations. Henley & Partners, the firm that publishes it, is a private residence and citizenship advisory business, not a government body.
In the January 2026 edition, Singapore ranked first with 192 destinations. Japan and South Korea shared second place with 188. Denmark, Luxembourg, Spain, Sweden and Switzerland followed in third with 186. The United Arab Emirates ranked fifth with 184, and the United States tenth with 179.
At the other end, Afghanistan ranked last with 24 destinations. The gap between the highest and lowest scores was 168 destinations, which Henley & Partners describes as the widest in the twenty-year history of the index. In 2006 the equivalent gap was 118.
*Compiled and edited by the Japan in Data editorial team based on official government statistics.
21.93 Million Valid Passports, or 17.8% of the Population
A holding rate needs two numbers that match each other. The ones used here are the passports issued inside Japan and the population living in Japan, measured days apart.
The Ministry of Foreign Affairs publishes the stock of valid passports at the end of each calendar year. At the end of 2025 there were 21,930,302 valid ordinary passports issued within Japan, made up of 4,121,460 five-year passports and 17,808,842 ten-year passports. Overseas missions had issued a further 823,788, giving 22,754,090 in total.
The Statistics Bureau of Japan put the total population at 122,979,985 on 1 January 2026. Dividing the domestic stock by that figure gives 17.8%. Fewer than one person in five holds a valid Japanese passport, and the stock rose by 1,174,650 over the year.
The denominator can be drawn differently. Only Japanese nationals may hold a Japanese passport, and the Japanese population of Japan stood at 119,249,893 on the same date. On that narrower base the rate is 18.4%. This article uses the total population throughout so that every figure rests on one definition.
*Compiled and edited by the Japan in Data editorial team based on official government statistics.
Annual Issuance Peaked at 6.24 Million in 1996
The stock of valid passports changes slowly. The flow of new passports each year moves much faster, and it has a clear high point.
Domestic issuance of ordinary passports rose through the early 1990s and reached 6,236,438 in 1996, the highest figure in the published series. It fell through the 2000s, dropping to 2,721,029 in 2003, then recovered to 4,365,290 in 2019.
The following three years were shaped by border measures. Issuance fell to 1,234,928 in 2020 and 513,943 in 2021, the lowest year in the series. It returned to 3,401,533 in 2023 and 3,700,111 in 2024, then eased to 3,493,238 in 2025. That is 56.0% of the 1996 peak.
*Compiled and edited by the Japan in Data editorial team based on official government statistics.
Departures Reached 14.73 Million in 2025, 73.4% of the 2019 Level
Passports are one measure. The number of trips actually taken is another, and the two series do not move together.
The Immigration Services Agency records departures by Japanese nationals, and the Ministry of Foreign Affairs reproduces the series back to 1956. Departures passed one million in 1971, ten million in 1990, and reached 20,080,669 in 2019, the highest figure recorded.
Departures fell to 3,174,219 in 2020 and 512,244 in 2021. They recovered to 9,624,152 in 2023 and 13,007,278 in 2024. The provisional figure for 2025 is 14,731,565, which is 73.4% of the 2019 total.
The two series diverge in an important way. Issuance in 2025 stood at 56.0% of its own 1996 peak while departures stood at 73.4% of their 2019 peak. Departures count trips rather than people, so a single traveller taking several trips is counted several times.
*Compiled and edited by the Japan in Data editorial team based on official government statistics.
Under-30s Accounted for 1.56 Million of the 2025 Applications
Who applied is recorded as well as how many. The age breakdown is published for domestic issuance each year.
Of the 3,493,238 ordinary passports issued in Japan in 2025, 770,008 went to people aged 19 or under and 790,090 to people in their twenties. Together the under-30s accounted for 1,560,098 passports, which the Ministry of Foreign Affairs reports as 44.6% of the total.
The remaining bands fall away steadily: 454,937 in the thirties, 463,107 in the forties, 481,238 in the fifties, 318,810 in the sixties, 179,039 in the seventies and 36,009 aged 80 or over. By sex, women accounted for 53.9% of domestic issuance and men for 46.1%.
The application route also changed during the year. Online applications for both new and renewal passports became available nationwide on 24 March 2025. The Ministry of Foreign Affairs reports that online use ran at about 36% across 2025 as a whole, against about 9% in 2024.
*Compiled and edited by the Japan in Data editorial team based on official government statistics.
How to Read These Figures: Five Points
First, the holding rate depends on the denominator. Using the total population gives 17.8%; using the Japanese population of Japan gives 18.4%. Neither is wrong, and the gap between them is larger than several of the year-on-year movements discussed above.
Second, valid passports are not the same as people. The domestic stock excludes the 823,788 ordinary passports issued by overseas missions, whose holders are largely resident outside Japan and therefore outside the population denominator used here.
Third, cross-country comparison of holding rates is harder than it looks. The U.S. Department of State counted 183,170,240 valid U.S. passports in fiscal 2025, but that total includes passport cards as well as books, and the Department notes that one person may hold more than one document.
Fourth, the Henley Passport Index is a private index built on IATA data rather than an official statistic, and it is updated through the year. The January 2026 edition is used here; later editions may show different scores.
Fifth, the 2025 departure figure is provisional. It is drawn from the Immigration Services Agency series and may be revised. Departures also count border crossings, not individual travellers.
Kaede’s Summary: Broad Access, Held by Fewer Than One in Five
Three observations from the figures above, with no interpretation added.
① Access and take-up sit at different levels. The passport reaches 188 of 227 destinations without a prior visa, and 17.8% of the population holds one.
② The issuance series has not returned to its former range. At 3,493,238 in 2025 it stands at 56.0% of the 1996 figure of 6,236,438.
③ Departures have recovered further than issuance, reaching 73.4% of the 2019 peak, though the two series count different things.
Frequently Asked Questions
Q1. Is Japan’s passport the strongest in the world?
Not in the January 2026 edition of the Henley Passport Index. Singapore ranked first with visa-free access to 192 destinations, and Japan shared second place with South Korea at 188. Japan did hold the top position in several earlier editions of the index. Because scores are updated through the year as visa agreements change, the ranking is a snapshot rather than a fixed attribute.
Q2. Why is the holding rate so much lower than in the United States?
The two figures are not directly comparable. The Japanese figure counts valid ordinary passports issued within Japan, one document per holder. The U.S. figure of 183,170,240 for fiscal 2025 counts passport books and passport cards together, and the Department of State states that a single person may hold more than one valid document. A like-for-like comparison would require separating books from cards.
Q3. Does a low holding rate mean Japanese people rarely travel abroad?
The two series answer different questions. In 2025 there were 14,731,565 departures by Japanese nationals, provisionally, against a stock of 21,930,302 valid domestic passports. Departures count border crossings rather than individuals, so this does not show how many separate people travelled. The published statistics do not record how often each passport holder uses their document.
🔍 About the Fact-Check for This Article
Japan in Data fact-checks its articles. The evidence behind the figures on this page is set out below.