
Two numbers answer this question. One is how many quality standards the water has to meet before it reaches the tap. The other is how many people are connected to a public supply at all. Both are published every year.
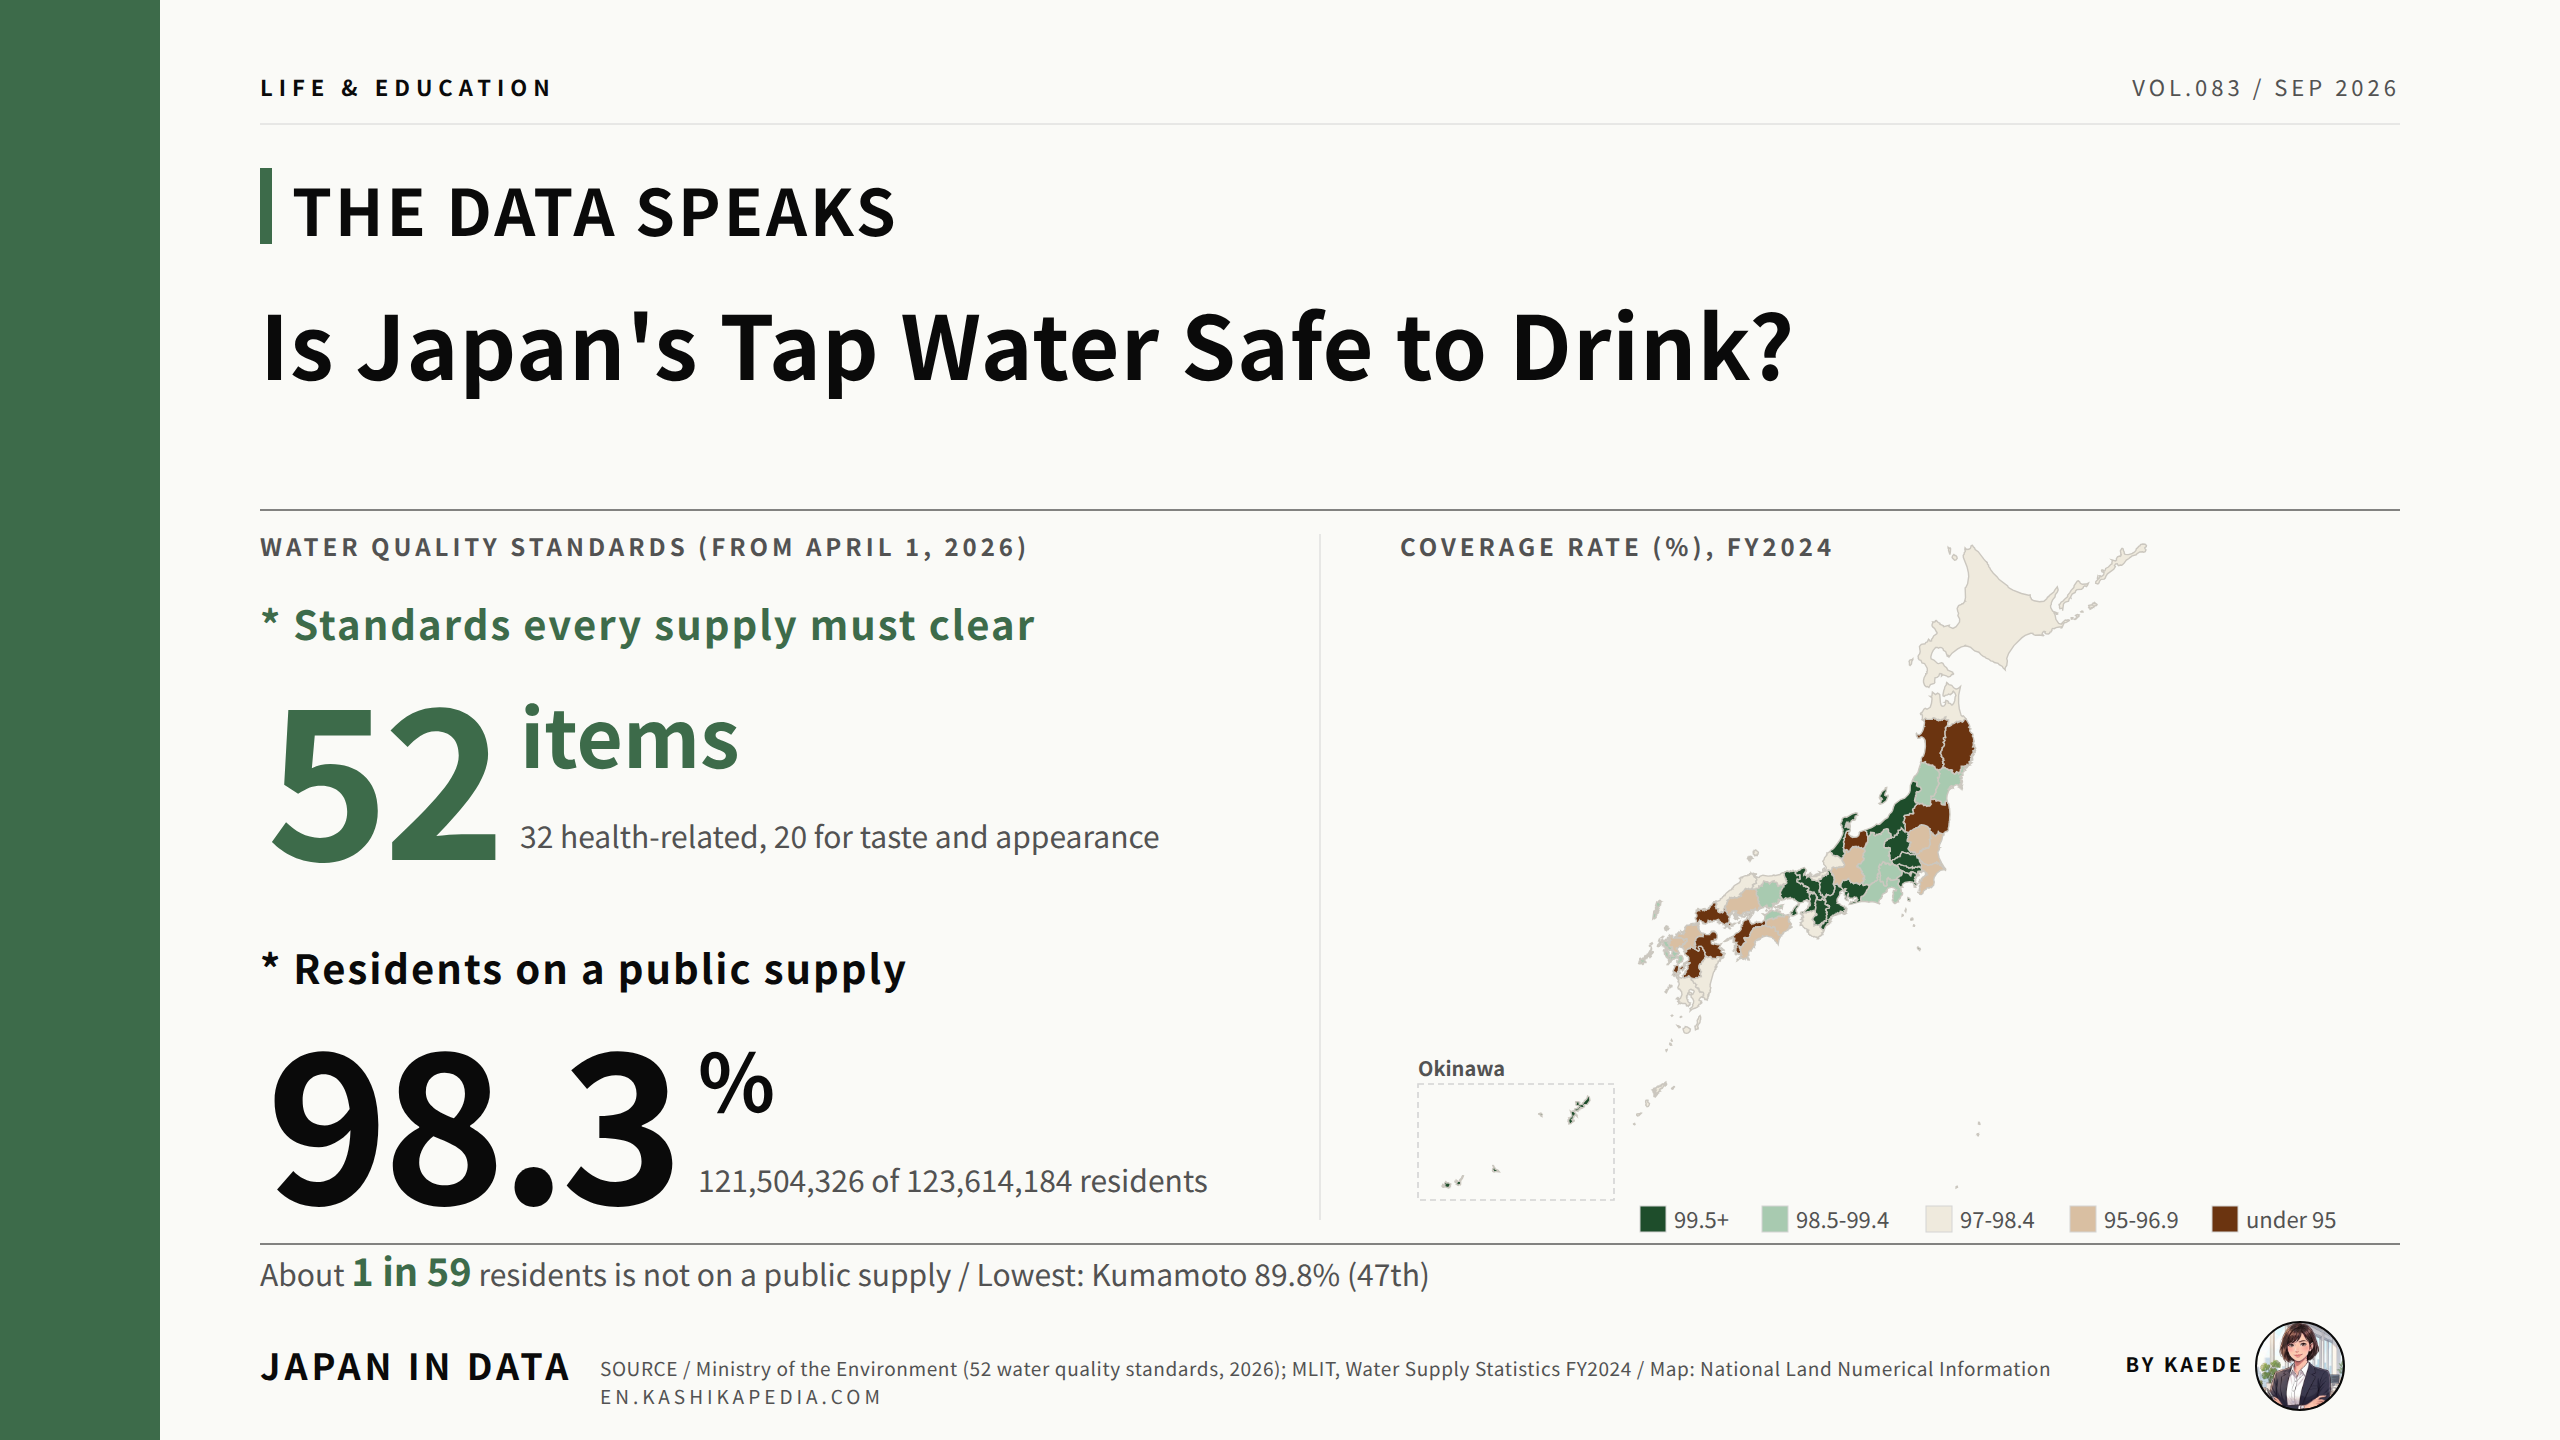
Tap water in Japan is regulated under the Water Supply Act, and water delivered by a public supply must meet the Water Quality Standards set by ministerial ordinance. From April 1, 2026 that list holds 52 items, 32 of them set for health. Colour, cloudiness and residual chlorine are checked at least once a day, and all 52 items at least once every three months.
The second number is coverage. As of March 31, 2025, 121,504,326 of Japan’s 123,614,184 residents were served by a public water supply, or 98.3%. This article sets out the 52 standards, the coverage figure for all 47 prefectures, and the 75-year record behind it, using published figures from the Ministry of the Environment and from the Ministry of Land, Infrastructure, Transport and Tourism.
Is Japan’s tap water safe to drink?
Every public supply has to clear 52 legal quality standards, and 98.3% of residents are connected to one.
This article was researched and edited by Kaede. The figures are those published at the time of writing. Statistics, rules and services can change, so please check the official sources for the current position.
- What tap water has to clear: 52 legal quality standards
- 98.3% of residents are on a public supply: all 47 prefectures
- All 47 prefectures ranked by coverage, with regional tabs
- Where coverage is highest and lowest, block by block
- From 26.2% to 98.3%: 75 years of the water supply
- How to read these numbers: three points
- Kaede’s summary: what these two numbers do and do not say
- Frequently Asked Questions
- About the Fact-Check for This Article
What tap water has to clear: 52 legal quality standards
Let us start with the rules themselves. The number of standard items changed in April 2026, so a figure you have read elsewhere may be the older one.
* Compiled and edited by the Japan in Data editorial team based on official government statistics.
Under Article 4 of the Water Supply Act, water supplied through a public system must meet the Water Quality Standards. From April 1, 2026 the list holds 52 items. Thirty-two are health-related and cover bacteria, metals, solvents and disinfection by-products. The other 20 cover taste, odour, colour, hardness and similar properties of everyday use.
The 52nd item is PFOS and PFOA, capped at 50 nanograms per litre for the two combined. Until March 2026 the pair sat on the ministry’s management target list rather than the binding standard, at the same provisional value. The ordinance making the change was issued on June 30, 2025 and took effect on April 1, 2026.
Fifty nanograms per litre is a small quantity to picture. The ministry illustrates one nanogram per litre as 1.2 grams of a substance dissolved in a Tokyo Dome filled with water, about 1.2 million cubic metres. At the standard value that Tokyo Dome would hold 60 grams.
Testing frequency is set separately from the limit values. Colour, cloudiness and residual chlorine are checked at least once a day. Nine basic items, among them E. coli, chloride and pH, are checked at least once a month. The full set of 52 items is checked at least once every three months.
98.3% of residents are on a public supply: all 47 prefectures
The map shows the share of residents connected to a public water supply. Darker green means a higher share, and the two panels below it list the highest and lowest eight.
* Compiled and edited by the Japan in Data editorial team based on official government statistics.
As of March 31, 2025, 121,504,326 of Japan’s 123,614,184 residents were served by a public water supply. That is 98.3%, against 98.2% a year earlier. The served population combines three system types: waterworks, small-scale waterworks and private waterworks.
Five prefectures record 100.0%: Tokyo, Aichi, Osaka, Nara and Okinawa. The lowest figure is Kumamoto at 89.8%, where 1,519,482 of 1,691,412 residents are connected. The spread between the highest and the lowest prefecture is 10.2 points. Twenty-one prefectures sit at 99.0% or above and eight sit below 95.0%.
All 47 prefectures ranked by coverage, with regional tabs
You can find a particular prefecture in the table below. The tabs switch between regional blocks, and all 47 rows stay on the page either way.
The table lists every prefecture from the highest coverage rate down. Rank, coverage, served population and total population appear together, so the size of a prefecture can be read alongside its rate. Prefectures sharing the same rate share the same rank.
Water supply coverage, all 47 prefectures (FY2024, highest first)
| Rank | Prefecture | Coverage | Served | Population |
|---|---|---|---|---|
| 1 | Aichi | 100.0% | 7,449,609 | 7,452,615 |
| 1 | Nara | 100.0% | 1,276,750 | 1,277,314 |
| 1 | Okinawa | 100.0% | 1,463,101 | 1,463,141 |
| 1 | Osaka | 100.0% | 8,762,302 | 8,762,704 |
| 1 | Tokyo | 100.0% | 14,218,206 | 14,218,464 |
| 6 | Hyogo | 99.9% | 5,307,205 | 5,312,981 |
| 6 | Kanagawa | 99.9% | 9,207,131 | 9,213,059 |
| 8 | Kyoto | 99.8% | 2,510,804 | 2,516,963 |
| 8 | Saitama | 99.8% | 7,306,806 | 7,321,033 |
| 8 | Shiga | 99.8% | 1,398,701 | 1,401,550 |
| 11 | Mie | 99.7% | 1,727,676 | 1,733,411 |
| 12 | Gunma | 99.6% | 1,892,967 | 1,900,638 |
| 13 | Ishikawa | 99.5% | 1,085,936 | 1,091,635 |
| 13 | Niigata | 99.5% | 2,071,530 | 2,080,895 |
| 15 | Okayama | 99.4% | 1,808,484 | 1,819,522 |
| 16 | Kagawa | 99.3% | 904,705 | 910,743 |
| 16 | Miyagi | 99.3% | 2,198,191 | 2,214,330 |
| 18 | Nagasaki | 99.1% | 1,228,064 | 1,238,888 |
| 18 | Shizuoka | 99.1% | 3,471,207 | 3,500,986 |
| 18 | Yamagata | 99.1% | 994,800 | 1,004,167 |
| 21 | Nagano | 99.0% | 1,955,408 | 1,974,563 |
| 22 | Yamanashi | 98.7% | 786,480 | 796,935 |
| 23 | Hokkaido | 98.4% | 4,933,372 | 5,015,776 |
| 24 | Aomori | 98.3% | 1,130,690 | 1,150,601 |
| 25 | Tottori | 98.2% | 520,650 | 530,235 |
| 25 | Wakayama | 98.2% | 871,286 | 887,007 |
| 27 | Miyazaki | 97.9% | 1,007,423 | 1,028,991 |
| 28 | Kagoshima | 97.8% | 1,511,418 | 1,546,078 |
| 29 | Shimane | 97.4% | 618,752 | 635,184 |
| 30 | Fukui | 97.0% | 720,507 | 742,933 |
| 31 | Tokushima | 96.6% | 660,801 | 684,018 |
| 32 | Tochigi | 96.1% | 1,822,300 | 1,896,350 |
| 33 | Chiba | 95.9% | 6,010,994 | 6,271,078 |
| 34 | Saga | 95.8% | 756,900 | 790,410 |
| 35 | Hiroshima | 95.4% | 2,592,218 | 2,716,382 |
| 36 | Ibaraki | 95.3% | 2,663,711 | 2,795,677 |
| 37 | Fukuoka | 95.2% | 4,850,961 | 5,093,936 |
| 37 | Kochi | 95.2% | 623,570 | 655,006 |
| 39 | Gifu | 95.0% | 1,805,643 | 1,901,558 |
| 40 | Iwate | 94.7% | 1,082,068 | 1,142,344 |
| 41 | Yamaguchi | 94.6% | 1,198,063 | 1,266,957 |
| 42 | Fukushima | 94.3% | 1,626,830 | 1,725,490 |
| 43 | Ehime | 94.0% | 1,210,281 | 1,287,978 |
| 44 | Toyama | 93.9% | 929,309 | 989,474 |
| 45 | Oita | 92.4% | 995,082 | 1,076,955 |
| 46 | Akita | 92.1% | 815,952 | 885,817 |
| 47 | Kumamoto | 89.8% | 1,519,482 | 1,691,412 |
| Rank | Prefecture | Coverage | Served | Population |
|---|---|---|---|---|
| 16 | Miyagi | 99.3% | 2,198,191 | 2,214,330 |
| 18 | Yamagata | 99.1% | 994,800 | 1,004,167 |
| 23 | Hokkaido | 98.4% | 4,933,372 | 5,015,776 |
| 24 | Aomori | 98.3% | 1,130,690 | 1,150,601 |
| 40 | Iwate | 94.7% | 1,082,068 | 1,142,344 |
| 42 | Fukushima | 94.3% | 1,626,830 | 1,725,490 |
| 46 | Akita | 92.1% | 815,952 | 885,817 |
| Rank | Prefecture | Coverage | Served | Population |
|---|---|---|---|---|
| 1 | Tokyo | 100.0% | 14,218,206 | 14,218,464 |
| 6 | Kanagawa | 99.9% | 9,207,131 | 9,213,059 |
| 8 | Saitama | 99.8% | 7,306,806 | 7,321,033 |
| 12 | Gunma | 99.6% | 1,892,967 | 1,900,638 |
| 32 | Tochigi | 96.1% | 1,822,300 | 1,896,350 |
| 33 | Chiba | 95.9% | 6,010,994 | 6,271,078 |
| 36 | Ibaraki | 95.3% | 2,663,711 | 2,795,677 |
| Rank | Prefecture | Coverage | Served | Population |
|---|---|---|---|---|
| 1 | Aichi | 100.0% | 7,449,609 | 7,452,615 |
| 13 | Ishikawa | 99.5% | 1,085,936 | 1,091,635 |
| 13 | Niigata | 99.5% | 2,071,530 | 2,080,895 |
| 18 | Shizuoka | 99.1% | 3,471,207 | 3,500,986 |
| 21 | Nagano | 99.0% | 1,955,408 | 1,974,563 |
| 22 | Yamanashi | 98.7% | 786,480 | 796,935 |
| 30 | Fukui | 97.0% | 720,507 | 742,933 |
| 39 | Gifu | 95.0% | 1,805,643 | 1,901,558 |
| 44 | Toyama | 93.9% | 929,309 | 989,474 |
| Rank | Prefecture | Coverage | Served | Population |
|---|---|---|---|---|
| 1 | Nara | 100.0% | 1,276,750 | 1,277,314 |
| 1 | Osaka | 100.0% | 8,762,302 | 8,762,704 |
| 6 | Hyogo | 99.9% | 5,307,205 | 5,312,981 |
| 8 | Kyoto | 99.8% | 2,510,804 | 2,516,963 |
| 8 | Shiga | 99.8% | 1,398,701 | 1,401,550 |
| 11 | Mie | 99.7% | 1,727,676 | 1,733,411 |
| 25 | Wakayama | 98.2% | 871,286 | 887,007 |
| Rank | Prefecture | Coverage | Served | Population |
|---|---|---|---|---|
| 15 | Okayama | 99.4% | 1,808,484 | 1,819,522 |
| 16 | Kagawa | 99.3% | 904,705 | 910,743 |
| 25 | Tottori | 98.2% | 520,650 | 530,235 |
| 29 | Shimane | 97.4% | 618,752 | 635,184 |
| 31 | Tokushima | 96.6% | 660,801 | 684,018 |
| 35 | Hiroshima | 95.4% | 2,592,218 | 2,716,382 |
| 37 | Kochi | 95.2% | 623,570 | 655,006 |
| 41 | Yamaguchi | 94.6% | 1,198,063 | 1,266,957 |
| 43 | Ehime | 94.0% | 1,210,281 | 1,287,978 |
| Rank | Prefecture | Coverage | Served | Population |
|---|---|---|---|---|
| 1 | Okinawa | 100.0% | 1,463,101 | 1,463,141 |
| 18 | Nagasaki | 99.1% | 1,228,064 | 1,238,888 |
| 27 | Miyazaki | 97.9% | 1,007,423 | 1,028,991 |
| 28 | Kagoshima | 97.8% | 1,511,418 | 1,546,078 |
| 34 | Saga | 95.8% | 756,900 | 790,410 |
| 37 | Fukuoka | 95.2% | 4,850,961 | 5,093,936 |
| 45 | Oita | 92.4% | 995,082 | 1,076,955 |
| 47 | Kumamoto | 89.8% | 1,519,482 | 1,691,412 |
* Compiled and edited by the Japan in Data editorial team based on official government statistics.
Where coverage is highest and lowest, block by block
Putting the prefectures on one axis by region shows how tightly each block sits together. The dashed line is the national figure.
* Compiled and edited by the Japan in Data editorial team based on official government statistics.
Kinki is the tightest block: its seven prefectures run from Wakayama at 98.2% to Osaka at 100.0%, a span of 1.8 points. Kyushu and Okinawa is the widest, running from Kumamoto at 89.8% to Okinawa at 100.0%, a span of 10.2 points.
In Hokkaido and Tohoku the range runs from Akita at 92.1% to Miyagi at 99.3%. Every one of the six blocks contains at least one prefecture above the national 98.3% figure, and four of the six also contain one below 95.0%.
From 26.2% to 98.3%: 75 years of the water supply
One more chart for context. The two markers show where the line crossed 50% and 90%.
* Compiled and edited by the Japan in Data editorial team based on official government statistics.
In fiscal 1950 the coverage rate was 26.2%, or roughly one resident in four. It passed 50% in fiscal 1960, reached 80.8% in fiscal 1970 and passed 90% in fiscal 1980. The steepest part of the climb falls in the 1960s and 1970s.
Since fiscal 2000 the series has moved inside a narrow band, from 96.6% to 98.3%. It reached 98.3% in fiscal 2022, read 98.2% in fiscal 2023 and returned to 98.3% in fiscal 2024. The published series shows five-year steps to fiscal 1995 and annual figures from fiscal 2000.
How to read these numbers: three points
Before drawing conclusions from the coverage rate, three things about how it is built are worth holding in mind.
* Compiled and edited by the Japan in Data editorial team based on official government statistics.
First, coverage and quality are separate measures. The rate counts how many residents are connected to a public system; the 52 standards apply to the water those systems deliver. A prefecture with a lower rate is not being described here as having water of a different quality.
Second, the residents outside a public system generally draw water from private wells or other small local sources, which the Water Supply Act does not cover. In fiscal 2024 that group came to 2,109,858 people. Third, the three system types are summed, and waterworks alone account for 98.5% of the served population.
Kaede’s summary: what these two numbers do and do not say
Having looked at the standards, the map, the table and the long record, here are the three observations I would take away.
The answer to the question at the top comes in two parts. Water from a public supply is held to 52 legal standards, and 98.3% of residents receive water from such a supply. Both figures describe a system, not the water in any single tap on any single day.
Taken together, the two numbers set out what is measured and what is not. The standards describe the water; the coverage rate describes the pipes. Reading them separately makes it easier to follow the annual updates, since the two are published by different ministries on different timetables.
Frequently Asked Questions
Three questions that come up often about drinking tap water in Japan. They are answered here with published figures only.
Q1. Is tap water in Japan meant to be drunk straight from the tap?
The Water Supply Act requires water delivered by a public supply to meet the 52 quality standards, and utilities are required to test it at the set frequencies. The law states this requirement for the supplier. Buildings with their own storage tanks are managed by the building owner under separate rules, so the responsible party differs after the water enters the building.
Q2. Why is the coverage rate not 100%?
The rate is the served population divided by the total population. Residents outside a public system generally use private wells or other small sources, which fall outside the Water Supply Act. In fiscal 2024 that group came to 2,109,858 people, about 1 in 59. The national rate has risen in every decade since fiscal 1950 without reaching 100%.
Q3. What is the position on PFAS?
PFOS and PFOA became a water quality standard on April 1, 2026, at 50 nanograms per litre combined. Before that they were a management target with the same provisional value. In the ministry’s national survey, 11 water utilities exceeded the provisional value in fiscal 2020 and none did in fiscal 2024 as of September 30 of that year. Seven further PFAS substances sit on the under-review list.
About the Fact-Check for This Article
Japan in Data fact-checks its articles. The evidence behind the figures on this page is set out below.