
Japan is often described as a country where hardly anyone is overweight. Before looking at the figures, it helps to know that Japan measures body weight against a different line from most of the world.
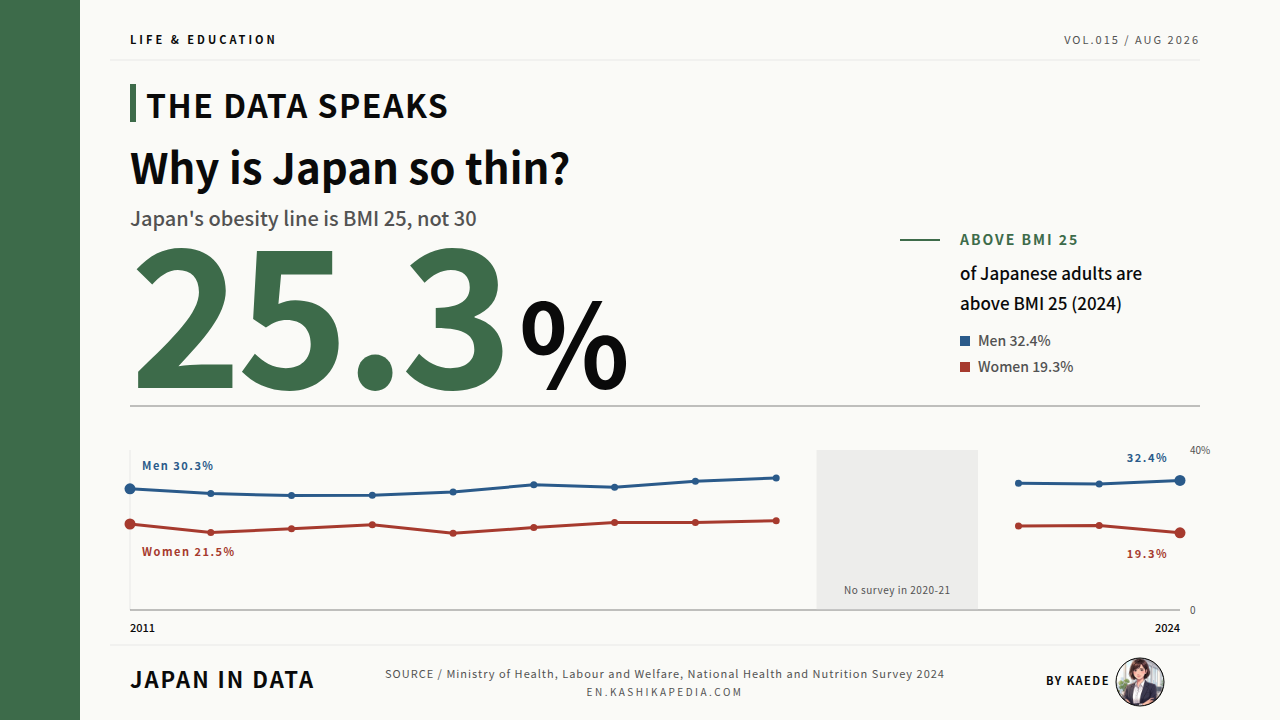
Japan’s Ministry of Health, Labour and Welfare classes an adult as obese at a body mass index of 25 and above. On that measure, 25.3% of adults aged 20 and over were above the line in the 2024 National Health and Nutrition Survey: 32.4% of men and 19.3% of women. The threshold used by the World Health Organization, BMI 30, sits 14.5 kg higher for an adult 170 cm tall.
This article follows what that survey measured. It sets out the two thresholds side by side, the national series since 2011, the pattern by age and sex, the share of young women below BMI 18.5, and the spread in average BMI across the 47 prefectures. Every figure comes from the ministry’s published results, and every kilogram conversion is our own.
Are Japanese adults as thin as the reputation suggests?
Under Japan’s own threshold of BMI 25, one adult in four is classed as obese. The international threshold of BMI 30 sits 14.5 kg higher for an adult 170 cm tall.
The National Health and Nutrition Survey is run each November by the Ministry of Health, Labour and Welfare under the Health Promotion Act. Survey staff measure height and weight rather than asking people to report them. Japan applies the criteria of the Japan Society for the Study of Obesity, which place the obesity line at BMI 25. The World Health Organization places its obesity line at BMI 30 and describes 25 to 29.9 as overweight. The 2020 and 2021 rounds were cancelled.
This article is researched and edited by Kaede. Figures are those published at the time of writing. Statistics and definitions are revised from time to time, so please check the official sources for the latest values.
- Japan Draws Its Obesity Line at BMI 25, the World at BMI 30
- One in Four Japanese Adults Sits Above Japan’s Line
- Men Peak in Their Fifties, Women Keep Rising With Age
- At the Other End, 16.6% of Young Women Are Below BMI 18.5
- Average BMI Runs From 24.9 in Kochi to 23.1 in Shiga
- Kaede’s Summary: One Body, Two Rulers
- Frequently Asked Questions
- 🔍 About the Fact-Check for This Article
Japan Draws Its Obesity Line at BMI 25, the World at BMI 30
Most of the confusion around this question comes from a single fact: Japan and the World Health Organization do not cut the scale at the same point. Everything that follows depends on which line is being used.
Compiled and edited by the Japan in Data editorial team based on official government statistics.
The Japanese criteria come from the Japan Society for the Study of Obesity and are the ones the ministry applies in its own report. They place the obesity line at BMI 25. The World Health Organization defines obesity among adults as BMI 30 and above, and describes the range from 25 to 29.9 as overweight. The same body can therefore be counted as obese in Tokyo and as overweight in London.
In kilograms the distance is easy to picture. For an adult 170 cm tall, BMI 25 works out at 72.3 kg and BMI 30 at 86.7 kg, a difference of 14.5 kg. Both figures use the same formula: weight in kilograms divided by height in metres squared. Neither threshold is a measurement of health on its own, and both are applied to measured rather than reported weight in this survey.
One in Four Japanese Adults Sits Above Japan’s Line
With the definition settled, the national series is worth reading slowly. The male and the female lines have not moved in the same way over the past decade.
Compiled and edited by the Japan in Data editorial team based on official government statistics.
For men, the share at or above BMI 25 rose from 30.3% in 2011 to 33.0% in 2019. The ministry records that increase between 2013 and 2019 as statistically significant, with no significant change since. The 2022 and 2023 rounds came in at 31.7% and 31.5%. For women the series has stayed inside a narrow band, between 19.2% and 22.3%, across the whole period.
The 2024 round put men at 32.4% and women at 19.3%. That round was the four-yearly expanded survey, covering about 10,400 households against 2,900 the year before, and the ministry does not place its value in the annual trend chart. The 2020 and 2021 surveys were cancelled, which is why the lines break in the middle.
Men Peak in Their Fifties, Women Keep Rising With Age
A single national percentage hides a wide spread. Splitting the 2024 figures by age and sex shows two quite different shapes.
Compiled and edited by the Japan in Data editorial team based on official government statistics.
Among men the share climbs from 21.0% in their twenties to a peak of 38.3% in their fifties, then falls back to 29.4% at 70 and over. Among women the shape runs the other way: 7.4% in their twenties, rising with each decade to 22.8% at 70 and over. The gap between men in their fifties and women in their twenties is more than five to one.
Reading across both sexes, 60.7% of adults were inside the range the ministry calls appropriate weight in 2024, against a national target of 66%. The ministry also reports the figures for the age bands used in its policy targets: 34.0% for men aged 20 to 69 and 20.2% for women aged 40 to 69.
At the Other End, 16.6% of Young Women Are Below BMI 18.5
The survey counts the thin end of the distribution as carefully as the heavy end. In Japan that side of the scale carries its own national target.
Compiled and edited by the Japan in Data editorial team based on official government statistics.
The share of women in their twenties and thirties measuring below BMI 18.5 was 16.6% in 2011 and has moved between 16.3% and 20.2% since. The 2023 round recorded 20.2%, the highest value in the published series, and the 2024 round recorded 16.6%. Health Japan 21, the national health plan, sets a target of 15% for this group.
Older adults are tracked with a separate marker. In 2024, 19.5% of people aged 65 and over were at or below BMI 20, which the ministry treats as a sign of undernutrition, against a target of 13%. Across the whole adult population, 14.0% were below the appropriate range and 25.3% above it.
Average BMI Runs From 24.9 in Kochi to 23.1 in Shiga
The 2024 round was large enough to report prefecture by prefecture, which happens only once every four years. It is the closest thing to a regional map of body weight in Japan.
Compiled and edited by the Japan in Data editorial team based on official government statistics.
For men aged 20 to 69, the age-adjusted mean BMI runs from 24.9 in Kochi, Iwate and Tokushima down to 23.1 in Shiga, against a national mean of 23.9. For women aged 40 to 69 the range is wider, from 24.1 in Nagasaki to 21.2 in Osaka, with a national mean of 22.3. The spread between the highest and lowest prefecture is 1.8 BMI points for men and 2.9 for women.
The ministry publishes these values without ranks. It states that the confidence intervals around each prefecture overlap enough that an order of 1 to 47 would not be meaningful, so it groups the results into quarters instead. The gap between the top quarter and the bottom quarter was 1.3 BMI points for men and 1.5 for women.
Kaede’s Summary: One Body, Two Rulers
Four figures, one survey. Here is what the 2024 data supports, and what it does not.
The question that brought most readers here, whether Japanese adults are thin, turns out to depend on which threshold is applied. Japan’s own statistics describe a quarter of the adult population as obese. The same population measured against the international threshold looks very different. Both descriptions come from the same measured heights and weights.
What the survey does not do is explain why the distribution sits where it does. It records measured heights and weights, not causes. Reading the number alongside its threshold, and alongside the thin end of the same distribution, gives a fuller picture than any single percentage. Japan in Data will follow the series as each annual round is published.
Kaede, Data Editor, Japan in Data. Based in Saitama, Japan.
Frequently Asked Questions
Three questions come up most often about these figures. They are mainly about definitions and about what can be compared with what.
Does Japan have the lowest obesity rate in the world?
Japan is regularly reported among the lowest in the OECD. In its Health at a Glance 2023 country note, the OECD put obesity prevalence in Japan at 4.6% against an OECD average of 25.7%, using the BMI 30 threshold. That figure is not comparable with the 25.3% in this article, which uses the Japanese BMI 25 threshold. The two numbers describe the same population against different lines.
Why does the 2024 figure not appear in the ministry’s trend chart?
The 2024 round was the four-yearly expanded survey, run in 473 districts rather than the usual 300, and the ministry applied weighting so that the national values remain comparable. Its published trend charts for body mass index run to 2023. This article shows 2024 as a separate point and labels it, rather than joining it to the annual series without comment.
What does BMI 25 mean in kilograms?
It depends on height, because BMI divides weight by height in metres squared. At 160 cm, BMI 25 is 64.0 kg and BMI 30 is 76.8 kg. At 170 cm the same thresholds are 72.3 kg and 86.7 kg, and at 180 cm they are 81.0 kg and 97.2 kg. The gap between the Japanese and the international line widens as height increases.
🔍 About the Fact-Check for This Article
Japan in Data fact-checks its articles. The evidence behind the figures on this page is set out below.