
Two questions come up whenever Tokyo and food are mentioned: how many restaurants the city has, and whether it has the most in the world. The first has an official answer. The second does not. This article shows what Japan’s census actually counts, for Tokyo and for all 47 prefectures.
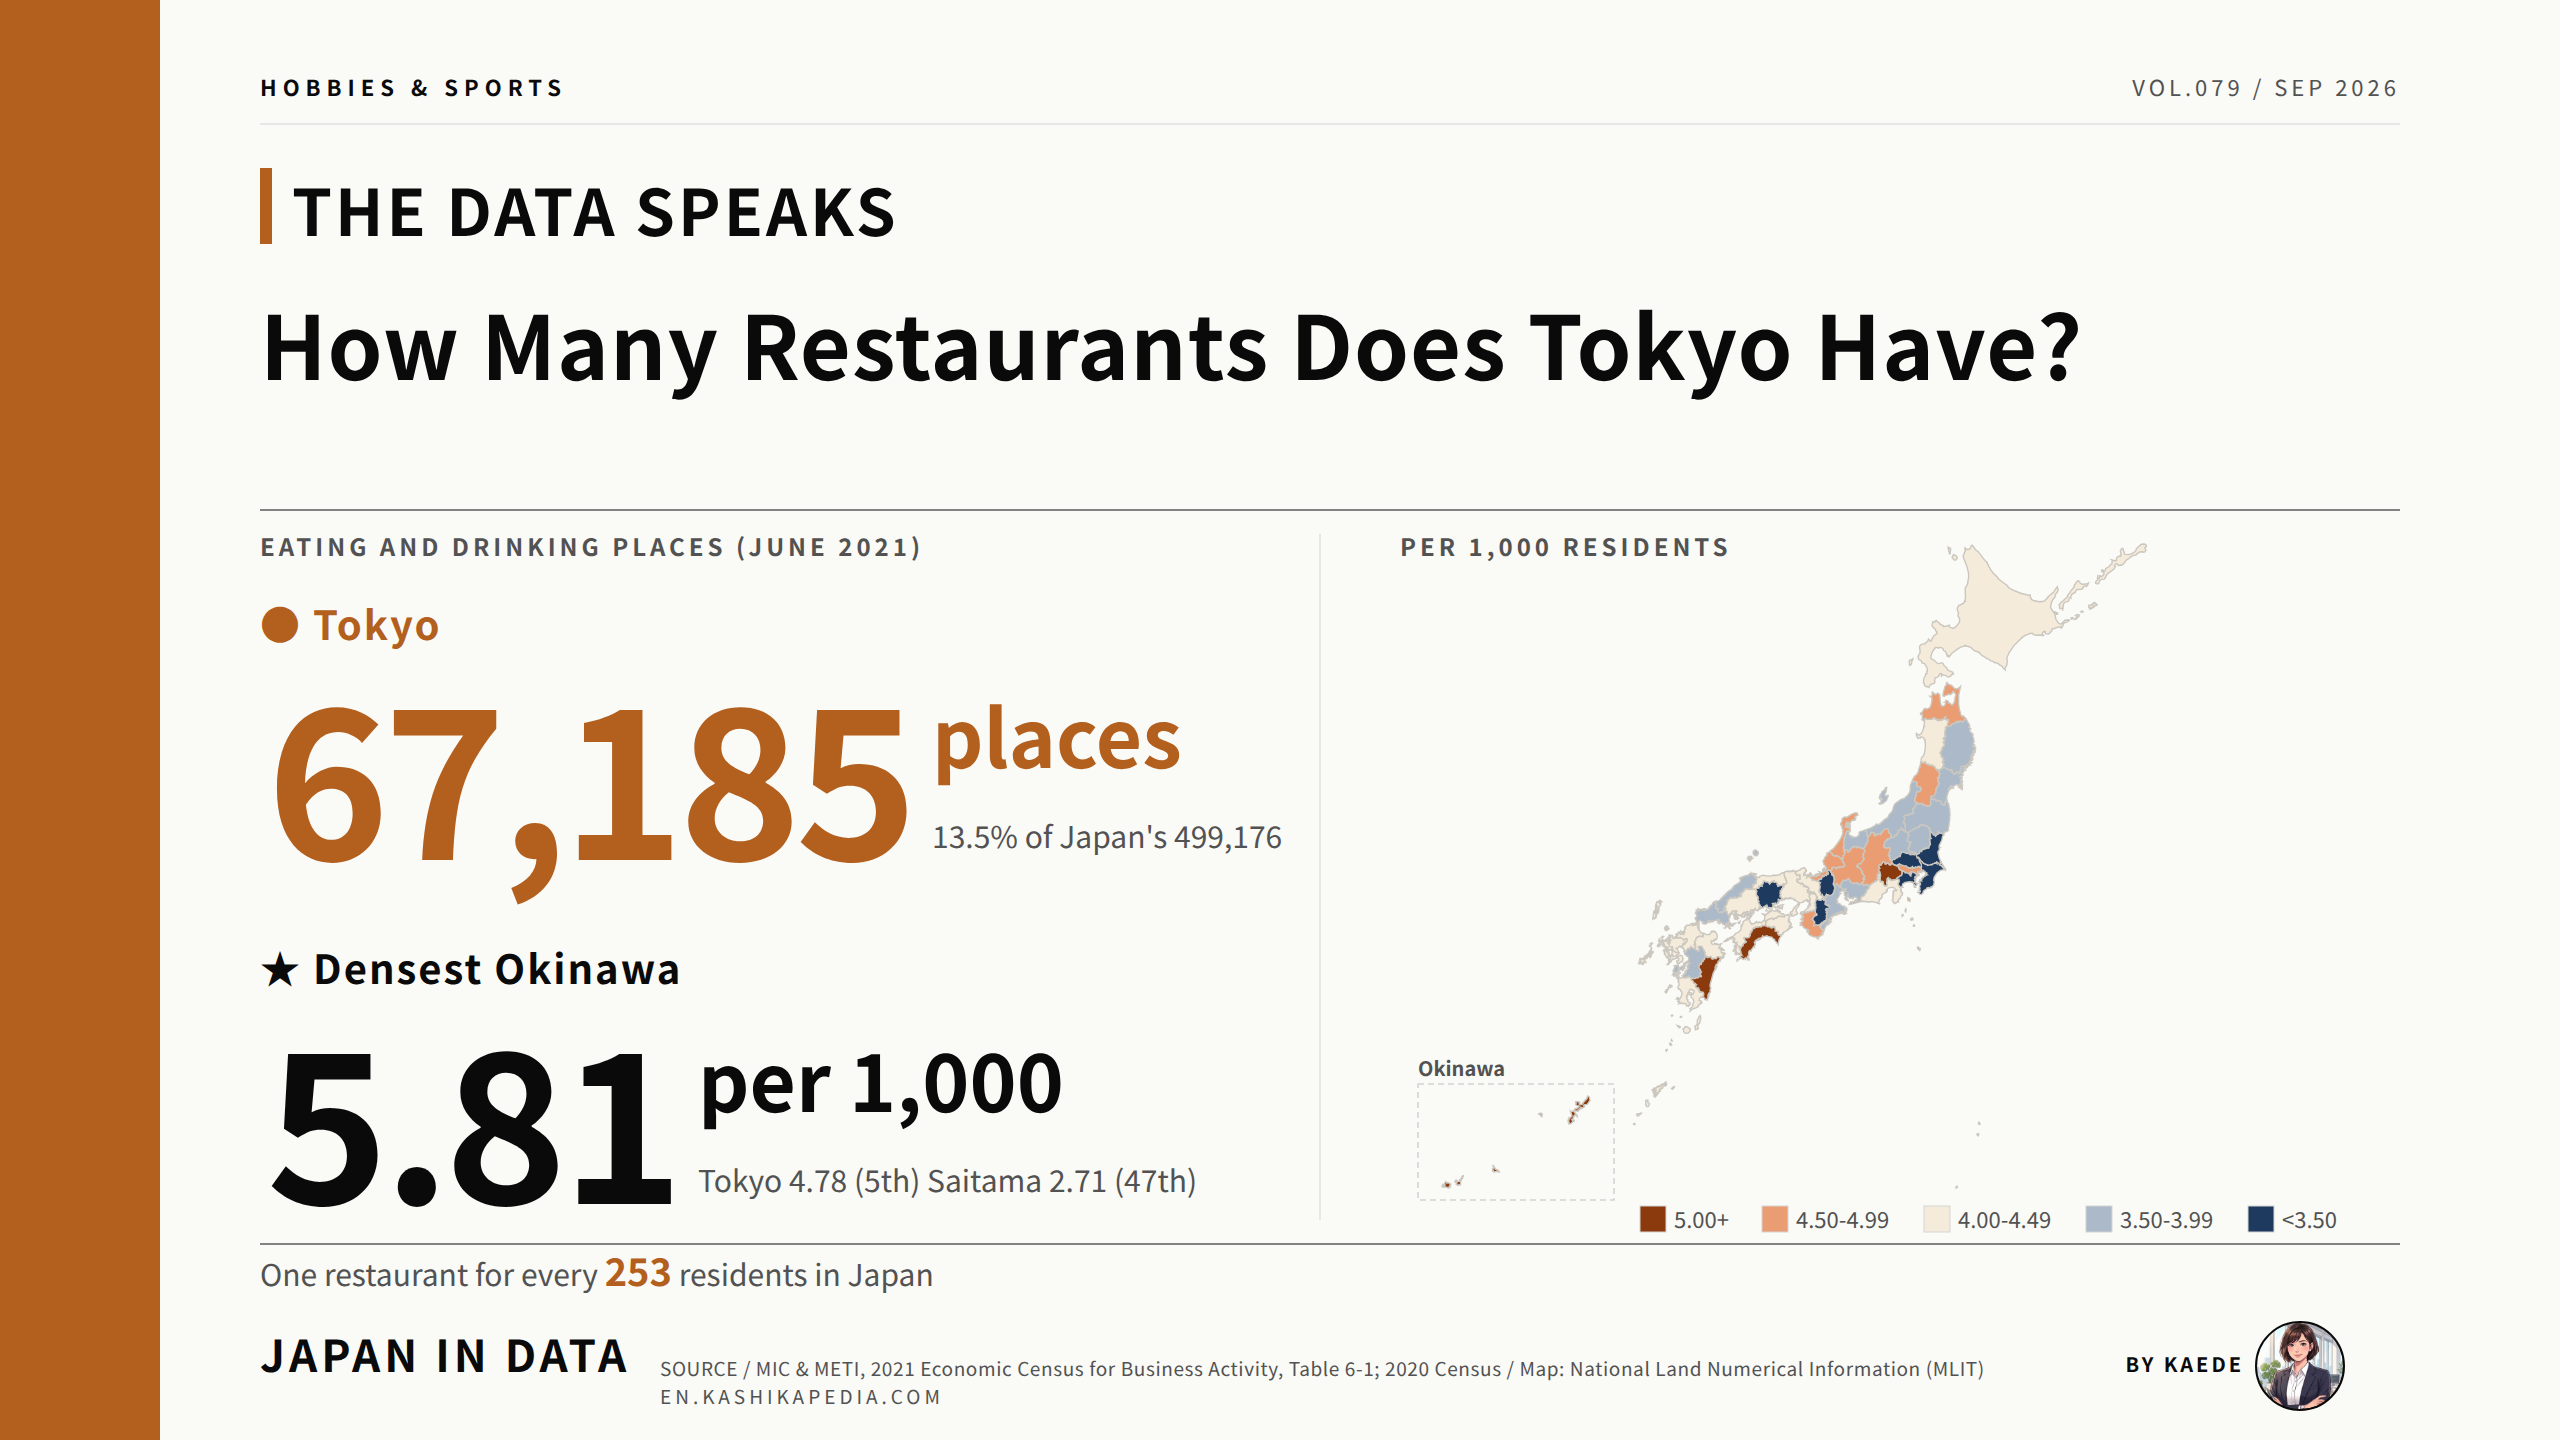
Tokyo had 67,185 eating and drinking places on June 1, 2021, according to the 2021 Economic Census for Business Activity. That is 13.5% of Japan’s national total of 499,176. Counted per resident, Tokyo drops to 5th place with 4.78 restaurants per 1,000 people, behind Okinawa, Kochi, Miyazaki and Yamanashi.
This article combines the census establishment count with 2020 Population Census figures to rank all 47 prefectures both by number and by density. It also looks at the ten largest cities, the size of a typical restaurant, and what the phrase “most restaurants in the world” can and cannot be checked against.
Japan is divided into 47 prefectures. Tokyo is one of them: the 23 central wards plus suburban cities and islands, 14.0 million residents in all. The Economic Census for Business Activity is a full count of every business establishment in Japan, taken every five years by the Ministry of Internal Affairs and Communications (MIC) and METI. “Eating and drinking places” is industry group 76 of the Japan Standard Industrial Classification: establishments whose main business is serving food or drink on the premises. Takeaway and delivery outlets are counted separately.
How many restaurants does Tokyo have?
67,185 in the 2021 census, 13.5% of Japan’s 499,176. Per resident, Tokyo ranks 5th of 47 prefectures.
This article was researched and edited by Kaede. Figures are as of the time of writing. Statistics and definitions are revised from time to time, so please check the official sources for the latest data.
- Okinawa Has the Most Restaurants per Resident: 47-Prefecture Tilemap
- All 47 Prefectures Ranked by Restaurants per 1,000 Residents
- By Number or per Resident: How the Ranking Changes
- Tokyo’s 23 Wards: 54,465 Restaurants in Ten Large Cities Compared
- How Big Is a Japanese Restaurant? Workers per Establishment
- Is Tokyo the Restaurant Capital of the World? What Official Data Can Say
- Kaede’s Notes: Three Observations from the Restaurant Count
- Frequently Asked Questions
- 🔍 About the Fact-Check for This Article
Okinawa Has the Most Restaurants per Resident: 47-Prefecture Tilemap
Raw counts follow population, so the tilemap shows restaurants per 1,000 residents instead. Darker brown means more places per resident, dark blue means fewer. The prefectures are arranged roughly in their geographic positions.
*Compiled and edited by the Japan in Data editorial team based on official government statistics.
Okinawa has the highest density at 5.81 eating and drinking places per 1,000 residents, followed by Kochi at 5.51, Miyazaki at 5.18 and Yamanashi at 5.06. Tokyo comes 5th at 4.78. Four of the top five are prefectures with under 1.5 million residents, and three of them are in Kyushu, Shikoku and Okinawa.
At the other end sit the three prefectures that surround Tokyo: Saitama at 2.71, Chiba at 2.74 and Kanagawa at 3.05, together with Nara and Shiga near Osaka and Kyoto. The national figure is 3.96. The gap between Okinawa and Saitama is 2.1 times.
All 47 Prefectures Ranked by Restaurants per 1,000 Residents
The full table lists every prefecture with its rank, density, raw count and population. The region tabs only filter the view. All 47 rows stay on the page.
The table below is sorted by eating and drinking places per 1,000 residents, from Okinawa at the top to Saitama at the bottom. The raw count column shows how differently the two measures behave: Tokyo’s 67,185 is more than 29 times Tottori’s 2,293, yet their densities are 4.78 and 4.14.
Eating and drinking places per 1,000 residents, all 47 prefectures (June 1, 2021)
| Rank | Prefecture | Per 1,000 | Restaurants | Population |
|---|---|---|---|---|
| 1 | Okinawa | 5.81 | 8,522 | 1,467,480 |
| 2 | Kochi | 5.51 | 3,808 | 691,527 |
| 3 | Miyazaki | 5.18 | 5,538 | 1,069,576 |
| 4 | Yamanashi | 5.06 | 4,096 | 809,974 |
| 5 | Tokyo | 4.78 | 67,185 | 14,047,594 |
| 6 | Fukui | 4.74 | 3,632 | 766,863 |
| 7 | Ishikawa | 4.62 | 5,235 | 1,132,526 |
| 8 | Nagano | 4.58 | 9,380 | 2,048,011 |
| 9 | Wakayama | 4.57 | 4,215 | 922,584 |
| 10 | Gifu | 4.52 | 8,937 | 1,978,742 |
| 11 | Aomori | 4.51 | 5,585 | 1,237,984 |
| 12 | Yamagata | 4.51 | 4,815 | 1,068,027 |
| 13 | Osaka | 4.49 | 39,639 | 8,837,685 |
| 14 | Kyoto | 4.47 | 11,520 | 2,578,087 |
| 15 | Tokushima | 4.30 | 3,097 | 719,559 |
| 16 | Hokkaido | 4.27 | 22,315 | 5,224,614 |
| 17 | Kagawa | 4.27 | 4,057 | 950,244 |
| 18 | Kagoshima | 4.27 | 6,777 | 1,588,256 |
| 19 | Oita | 4.25 | 4,775 | 1,123,852 |
| 20 | Saga | 4.25 | 3,447 | 811,442 |
| 21 | Nagasaki | 4.21 | 5,522 | 1,312,317 |
| 22 | Shizuoka | 4.18 | 15,183 | 3,633,202 |
| 23 | Tottori | 4.14 | 2,293 | 553,407 |
| 24 | Fukuoka | 4.11 | 21,096 | 5,135,214 |
| 25 | Hiroshima | 4.11 | 11,493 | 2,799,702 |
| 26 | Akita | 4.09 | 3,929 | 959,502 |
| 27 | Ehime | 4.05 | 5,409 | 1,334,841 |
| 28 | Hyogo | 4.04 | 22,055 | 5,465,002 |
| 29 | Iwate | 3.97 | 4,804 | 1,210,534 |
| 30 | Aichi | 3.93 | 29,632 | 7,542,415 |
| 31 | Niigata | 3.91 | 8,616 | 2,201,272 |
| 32 | Toyama | 3.85 | 3,979 | 1,034,814 |
| 33 | Shimane | 3.81 | 2,555 | 671,126 |
| 34 | Tochigi | 3.79 | 7,329 | 1,933,146 |
| 35 | Gunma | 3.69 | 7,147 | 1,939,110 |
| 36 | Fukushima | 3.68 | 6,740 | 1,833,152 |
| 37 | Miyagi | 3.67 | 8,447 | 2,301,996 |
| 38 | Kumamoto | 3.66 | 6,369 | 1,738,301 |
| 39 | Mie | 3.60 | 6,380 | 1,770,254 |
| 40 | Yamaguchi | 3.59 | 4,824 | 1,342,059 |
| 41 | Okayama | 3.33 | 6,286 | 1,888,432 |
| 42 | Ibaraki | 3.23 | 9,253 | 2,867,009 |
| 43 | Kanagawa | 3.05 | 28,178 | 9,237,337 |
| 44 | Shiga | 3.00 | 4,236 | 1,413,610 |
| 45 | Nara | 2.84 | 3,764 | 1,324,473 |
| 46 | Chiba | 2.74 | 17,212 | 6,284,480 |
| 47 | Saitama | 2.71 | 19,870 | 7,344,765 |
| Rank | Prefecture | Per 1,000 | Restaurants | Population |
|---|---|---|---|---|
| 11 | Aomori | 4.51 | 5,585 | 1,237,984 |
| 12 | Yamagata | 4.51 | 4,815 | 1,068,027 |
| 16 | Hokkaido | 4.27 | 22,315 | 5,224,614 |
| 26 | Akita | 4.09 | 3,929 | 959,502 |
| 29 | Iwate | 3.97 | 4,804 | 1,210,534 |
| 36 | Fukushima | 3.68 | 6,740 | 1,833,152 |
| 37 | Miyagi | 3.67 | 8,447 | 2,301,996 |
| Rank | Prefecture | Per 1,000 | Restaurants | Population |
|---|---|---|---|---|
| 5 | Tokyo | 4.78 | 67,185 | 14,047,594 |
| 34 | Tochigi | 3.79 | 7,329 | 1,933,146 |
| 35 | Gunma | 3.69 | 7,147 | 1,939,110 |
| 42 | Ibaraki | 3.23 | 9,253 | 2,867,009 |
| 43 | Kanagawa | 3.05 | 28,178 | 9,237,337 |
| 46 | Chiba | 2.74 | 17,212 | 6,284,480 |
| 47 | Saitama | 2.71 | 19,870 | 7,344,765 |
| Rank | Prefecture | Per 1,000 | Restaurants | Population |
|---|---|---|---|---|
| 4 | Yamanashi | 5.06 | 4,096 | 809,974 |
| 6 | Fukui | 4.74 | 3,632 | 766,863 |
| 7 | Ishikawa | 4.62 | 5,235 | 1,132,526 |
| 8 | Nagano | 4.58 | 9,380 | 2,048,011 |
| 10 | Gifu | 4.52 | 8,937 | 1,978,742 |
| 22 | Shizuoka | 4.18 | 15,183 | 3,633,202 |
| 30 | Aichi | 3.93 | 29,632 | 7,542,415 |
| 31 | Niigata | 3.91 | 8,616 | 2,201,272 |
| 32 | Toyama | 3.85 | 3,979 | 1,034,814 |
| Rank | Prefecture | Per 1,000 | Restaurants | Population |
|---|---|---|---|---|
| 9 | Wakayama | 4.57 | 4,215 | 922,584 |
| 13 | Osaka | 4.49 | 39,639 | 8,837,685 |
| 14 | Kyoto | 4.47 | 11,520 | 2,578,087 |
| 28 | Hyogo | 4.04 | 22,055 | 5,465,002 |
| 39 | Mie | 3.60 | 6,380 | 1,770,254 |
| 44 | Shiga | 3.00 | 4,236 | 1,413,610 |
| 45 | Nara | 2.84 | 3,764 | 1,324,473 |
| Rank | Prefecture | Per 1,000 | Restaurants | Population |
|---|---|---|---|---|
| 2 | Kochi | 5.51 | 3,808 | 691,527 |
| 15 | Tokushima | 4.30 | 3,097 | 719,559 |
| 17 | Kagawa | 4.27 | 4,057 | 950,244 |
| 23 | Tottori | 4.14 | 2,293 | 553,407 |
| 25 | Hiroshima | 4.11 | 11,493 | 2,799,702 |
| 27 | Ehime | 4.05 | 5,409 | 1,334,841 |
| 33 | Shimane | 3.81 | 2,555 | 671,126 |
| 40 | Yamaguchi | 3.59 | 4,824 | 1,342,059 |
| 41 | Okayama | 3.33 | 6,286 | 1,888,432 |
| Rank | Prefecture | Per 1,000 | Restaurants | Population |
|---|---|---|---|---|
| 1 | Okinawa | 5.81 | 8,522 | 1,467,480 |
| 3 | Miyazaki | 5.18 | 5,538 | 1,069,576 |
| 18 | Kagoshima | 4.27 | 6,777 | 1,588,256 |
| 19 | Oita | 4.25 | 4,775 | 1,123,852 |
| 20 | Saga | 4.25 | 3,447 | 811,442 |
| 21 | Nagasaki | 4.21 | 5,522 | 1,312,317 |
| 24 | Fukuoka | 4.11 | 21,096 | 5,135,214 |
| 38 | Kumamoto | 3.66 | 6,369 | 1,738,301 |
*Compiled and edited by the Japan in Data editorial team based on official government statistics.
Where two prefectures show the same rounded value, ranks follow the unrounded figures: Aomori (4.5114) is placed above Yamagata (4.5083), and Hokkaido, Kagawa and Kagoshima at 4.27 are separated the same way. The population column uses the 2020 Census, taken eight months before the establishment count.
By Number or per Resident: How the Ranking Changes
The number of restaurants tracks population. Dividing by residents turns the ranking almost upside down. The slope chart connects each prefecture’s two ranks.
*Compiled and edited by the Japan in Data editorial team based on official government statistics.
By number, the top four are Tokyo, Osaka, Aichi and Kanagawa, the four most populous prefectures after Tokyo’s neighbours. Only Tokyo stays in the top five on both measures. Osaka falls from 2nd to 13th, Aichi from 3rd to 30th, and Kanagawa from 4th to 43rd.
The reverse movement is just as large. Kochi is 41st by number with 3,808 places and 2nd per resident. Miyazaki moves from 27th to 3rd, Yamanashi from 37th to 4th. Saitama and Chiba, 8th and 9th by number, are 47th and 46th per resident. The data shows the pattern; it does not explain it.
Tokyo’s 23 Wards: 54,465 Restaurants in Ten Large Cities Compared
The question “how many restaurants does Tokyo have” usually means the city, not the prefecture. The same census table gives figures for the 23 special wards and for other large cities.
*Compiled and edited by the Japan in Data editorial team based on official government statistics.
The 23 wards of Tokyo held 54,465 eating and drinking places, 81.1% of the prefecture’s total, with 9,733,276 residents. That is 5.60 per 1,000, or one restaurant for every 179 residents in central Tokyo. Osaka City is denser still at 7.47, and Kyoto City at 5.75.
Among the ten cities, Yokohama and Saitama City have the lowest density at 2.92 and 2.55, even though Yokohama’s count of 11,021 is the fourth largest. The census counts residents where they live, while restaurant customers include commuters and visitors, so the resident-based rate and the raw count measure different things.
How Big Is a Japanese Restaurant? Workers per Establishment
The census also records workers at each establishment. Dividing workers by places gives a rough measure of restaurant size, which differs a great deal by prefecture.
*Compiled and edited by the Japan in Data editorial team based on official government statistics.
Japan’s 499,176 eating and drinking places employed 3,489,039 people on June 1, 2021, an average of 7.0 per establishment. Kanagawa and Tokyo average 8.7 workers per place, Aomori 4.4. Chiba, Saitama, Shiga and Nara, which rank low on density, all average more than 8 workers.
Read together with the density map, the figures show two patterns: many small places per resident in Okinawa, Kochi and the Tohoku prefectures, and fewer but larger places in the suburbs of Tokyo and Osaka. Workers here include owners, unpaid family members and part-time staff, as defined by the census.
Is Tokyo the Restaurant Capital of the World? What Official Data Can Say
Rankings of world cities by restaurant count circulate widely. Before comparing, it helps to know exactly what Japan’s figure includes and excludes.
*Compiled and edited by the Japan in Data editorial team based on official government statistics.
The census counts establishments, so a chain with 50 branches contributes 50. It counts only places whose main business is serving food or drink on site, so takeaway shops, delivery kitchens and hotel dining rooms are classified elsewhere. Other countries count restaurants under different classifications and different rules, and no international body publishes a city-level table on a single definition.
For that reason this article does not rank Tokyo against Paris, New York or Seoul. What the official record supports is narrower: 67,185 eating and drinking places in Tokyo Prefecture and 54,465 in the 23 wards as of June 1, 2021. Figures based on restaurant review sites or business directories measure something else and are not used here.
Timing also matters. The 2021 count was taken during COVID-19 restrictions on restaurant opening hours. The previous census in 2016 recorded 590,847 places, but MIC notes that the 2021 survey list was expanded using the corporate number register and advises against simple comparison between the two years. A new census was taken on June 1, 2026; its results are not yet published.
Kaede’s Notes: Three Observations from the Restaurant Count
Here is what the figures show, kept to observations. Why Okinawa or Kochi have so many places per resident is a question the census cannot answer.
The answer to “how many restaurants does Tokyo have” is 67,185 on the official establishment count, or 54,465 for the 23 wards. Whether that is the most in the world is a different question, and one that official statistics do not settle. The observations below summarise what the census does show.
Taken together, the three observations point to a reading habit rather than a verdict. A count and a rate answer different questions, and neither one alone describes a city. When the 2026 census results are published, the same two measures can be placed side by side with these 2021 figures, and that comparison is the one I plan to make.
Frequently Asked Questions
Three questions readers are likely to ask about the restaurant count, mostly about definitions and calculation.
Q1. How was “restaurants per 1,000 residents” calculated?
The number of eating and drinking places (JSIC group 76) in Table 6-1 of the 2021 Economic Census for Business Activity was divided by the 2020 Population Census population as of October 1, 2020, and multiplied by 1,000. For Okinawa: 8,522 divided by 1,467,480 times 1,000 equals 5.81. The two counts are eight months apart.
Q2. Does the figure include cafes, bars and fast food?
Yes. JSIC group 76 covers general restaurants, specialty restaurants such as sushi, ramen and yakiniku, noodle shops, cafes, bars, pubs and hamburger outlets, as long as customers eat or drink on the premises. Takeaway-only and delivery-only outlets are group 77 and are not included in this article’s figures.
Q3. Is Tokyo really the city with the most restaurants in the world?
Official statistics cannot answer that. Japan’s census gives a precise count for Tokyo, but other countries use different classifications, different survey methods and different city boundaries. Comparisons published online usually rely on review sites or directories, which are not official sources. This article limits itself to the Japanese census figures.
🔍 About the Fact-Check for This Article
Japan in Data fact-checks its articles. The evidence used for this page is listed below.