
A question like “how much have bear attacks increased” is easiest to answer by placing the long run of injury figures next to the map of where those injuries happened. Laid over each other, the shape of the change becomes visible.
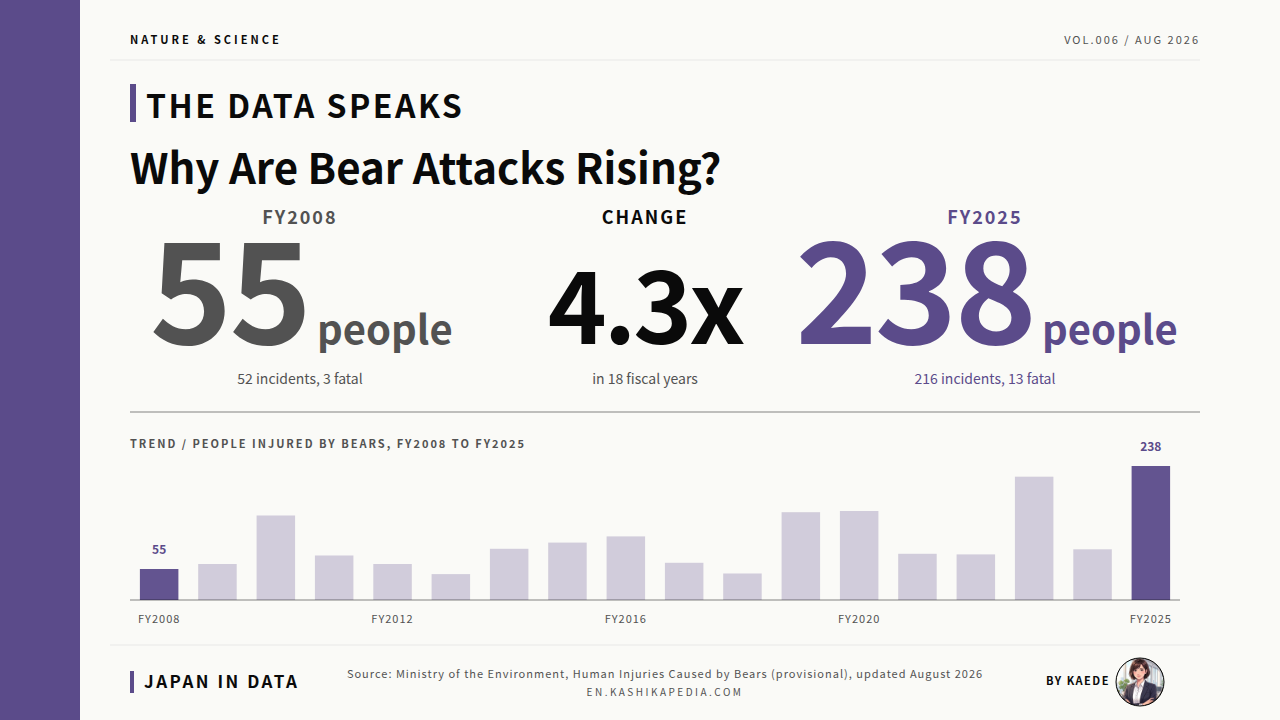
Reports of bear encounters in Japan have grown steadily more prominent, and the underlying figures have moved with them. Ministry of the Environment data show that the number of people injured by bears rose from 55 in FY2008 to 238 in FY2025, a 4.3-fold level, while deaths went from 3 to 13.
The other measures moved in the same direction. Sighting reports reached 50,801 in FY2025 against 11,136 three years earlier, and permit captures reached 14,741 animals. Injuries, sightings and permit captures all recorded their highest figures in the same fiscal year.
This article sets out six charts drawn from the ministry’s provisional releases on injuries, sightings and permit captures, together with the Biodiversity Center’s distribution survey: the 18-year injury series, monthly sightings, a prefecture cartogram, the capture series, a policy timeline and regional range change. Eighteen years of continuous statistics and eighty years of policy sit side by side.
Japan has two bear species: the brown bear, found only in Hokkaido, and the smaller Asiatic black bear, found on Honshu and Shikoku. Kyushu and Okinawa have none. Figures here are counted by fiscal year, which runs from April to March, so FY2025 covers April 2025 to March 2026. The Ministry of the Environment collects them from the 47 prefectures and publishes them as provisional figures that are revised as prefectures update their returns.
How far have bear attacks in Japan actually risen?
Injuries are 4.3 times the level of 18 years ago, and sightings 4.6 times the level of three years ago.
Researched and edited by Kaede, Data Editor, Japan in Data. Based in Saitama, Japan. Figures are current as of publication. Statistics, rules and services change, so please check the official sources for the latest position.
- From 55 to 238: Eighteen Years of Injury Figures
- Sightings Reached 50,801, With 15,998 in October Alone
- Where the Injuries Happened: All 47 Prefectures Mapped
- Permit Captures Reached 14,741 Animals in FY2025
- Eighty Years of Policy: From the Spring Cull to Emergency Shooting
- Range Grew About Twofold in 40 Years, and 2.7-Fold in Chugoku
- Kaede’s Summary: Four Measures That Peaked in the Same Year
- Frequently Asked Questions
- 🔍 About the Fact-Check for This Article
From 55 to 238: Eighteen Years of Injury Figures
Incidents, people injured and deaths sit on one chart here. Reading the three together, the starting point, the earlier high and the latest year line up at a glance.
* Compiled and edited by the Japan in Data editorial team based on official government statistics.
The ministry’s series on human injuries begins in FY2008, which recorded 52 incidents, 55 people injured and 3 deaths. For most of the following decade the annual figure sat between 50 and 160 people, with 150 in the mass-sighting year of FY2010 and a return to roughly 100 in the years after.
The range shifts upward in the 2020s. FY2019 recorded 157 people injured and FY2020 158, and FY2023 reached 219, which was the previous high. FY2025 recorded 216 incidents, 238 people injured and 13 deaths, the highest figures in all three columns since the series began.
Deaths follow a similar path. The count sat at 3 in FY2008 and reached 4 or 5 in several later years, but FY2025 is the first year above ten. Against the FY2008 baseline, deaths and injuries have both moved by a factor of about 4.3, so the severity of incidents has kept pace with their number rather than lagging behind it.
These are provisional figures. The ministry collects them from prefectures and revises them as returns are updated, so the FY2025 numbers may still move slightly.
Sightings Reached 50,801, With 15,998 in October Alone
Annual totals hide the shape of the year. Plotting four fiscal years month by month shows where the peak sits and how far the latest one stands above the rest.
* Compiled and edited by the Japan in Data editorial team based on official government statistics.
Sighting reports totalled 11,136 in FY2022, 24,348 in FY2023, 20,513 in FY2024 and 50,801 in FY2025. Against FY2022 that is a 4.6-fold level in three years. The figures exclude Hokkaido, which does not publish sighting counts, and each prefecture compiles them by its own method, from police calls to municipal reports.
Within FY2025 the reports cluster in autumn: 4,766 in September, 15,998 in October and 10,338 in November. October 2025 on its own produced more sighting reports than the whole of FY2022, so a single month exceeded a full year at the FY2022 level.
The ministry and prefectural authorities attribute the autumn concentration mainly to a poor crop of beech and oak mast across the Tohoku and Hokuriku regions, alongside abandoned farmland along the edge of settlements and the wider range described later in this article. FY2026 is running above the previous year so far, with 12,628 reports logged from April to June 2026.
Where the Injuries Happened: All 47 Prefectures Mapped
Regional differences are hard to read from a table. On a cartogram the darker tiles and the grey ones separate immediately, and the boundary between them is itself the point.
* Compiled and edited by the Japan in Data editorial team based on official government statistics.
Of the 238 people injured in FY2025, the five highest prefectures were Akita with 67, Iwate with 40, Fukushima with 24, Niigata with 17 and Nagano with 16. Those five account for 164 people, or about 69 percent of the national total. The six prefectures of the Tohoku region together account for 158, about 66 percent.
The pattern is concentration rather than a nationwide rise. Twenty-five prefectures recorded no injuries at all in FY2025, and their boundaries follow the range of the two species fairly closely. Kyushu has recorded no confirmed Asiatic black bear since 1957, and Okinawa has never had bears.
The gap between the ends of the distribution is wide. Akita’s 67 people compares with a single person injured in Tokyo, Hyogo, Shimane and Hiroshima. Akita also stands well clear of the other Tohoku prefectures, so the range within Tohoku is itself wide.
One caution on this map. Prefecture-level figures have moved between ministry releases even where the national total has not: the April 2026 release and the August 2026 release both total 238 people, but they differ for several prefectures. The map here uses the August 2026 release.
Permit Captures Reached 14,741 Animals in FY2025
Splitting captures by species shows two different slopes. The Asiatic black bear line is the one that has changed shape most.
* Compiled and edited by the Japan in Data editorial team based on official government statistics.
Permit captures are animals taken under prefectural permission for damage control and population management, so the series works as a rough measure of the response rather than of the bear population itself. The total was 1,492 animals in FY2008 and 14,741 in FY2025, a 9.9-fold level over 18 years.
By species, brown bear captures went from 355 to 2,139, a 6.0-fold level, and Asiatic black bear captures from 1,137 to 12,602, an 11.1-fold level. The FY2025 figure of 12,602 Asiatic black bears is the highest for that species alone since the series began.
Captures have grown faster than injuries over the same 18 years, 9.9-fold against 4.3-fold. Prefectures have widened their permit allowances as sightings rose, and the designation of bears as a managed species in April 2024 put a wider framework behind that. What the higher capture figures mean for the population will only be readable against the injury figures for FY2026 and later.
Eighty Years of Policy: From the Spring Cull to Emergency Shooting
Placing the rules on a timeline shows where the balance between protection and management moved, and how close together the two most recent changes sit.
* Compiled and edited by the Japan in Data editorial team based on official government statistics.
Policy on bears falls into four broad periods. Hokkaido ran a spring cull of brown bears from 1966, aimed at animals emerging from hibernation, until numbers fell far enough that the programme was ended in 1990. Protection and recovery followed, and the range widened over the same decades.
The 2014 revision renamed the governing statute the Wildlife Protection and Management Act and wrote population management into it explicitly. FY2004 and FY2006 are both recorded as mass-sighting years, but they predate the current continuous series and were compiled differently, so they are not directly comparable with the figures in this article.
Two changes came in quick succession. Bears outside Shikoku were designated a managed species in April 2024, which brought funding and cross-prefecture coordination. Emergency shooting provisions took effect in September 2025, allowing municipalities to authorise the shooting of bears in built-up areas. Ministerial meetings on bear damage began the following month.
Range Grew About Twofold in 40 Years, and 2.7-Fold in Chugoku
Range change is clearest as a set of bars by region. Chugoku at one end and Shikoku and Kyushu at the other describe two opposite movements in the same country.
* Compiled and edited by the Japan in Data editorial team based on official government statistics.
The Biodiversity Center’s distribution survey records occupied 5 km grid cells roughly once every fifteen years, most recently for 2018. Across the forty years from 1978 to 2018 the combined range of the two species roughly doubled. Setting the 2003 survey at 100, the regional figures for 2018 show how unevenly that happened.
Chugoku grew the most, to about 270 percent, followed by Kinki at 169, Tohoku at 134, Hokkaido at 129 for brown bears, Chubu at 127 and Kanto at 126. The geography of range growth does not match the geography of injuries: Chugoku recorded two injuries in FY2025, while Tohoku, with more modest growth, recorded 158.
Two regions moved the other way. Shikoku fell to about 88 percent of its 2003 range, and the small population in the mountains of Tokushima and Kochi is listed as endangered. In Kyushu the last confirmed capture was in the Sobo mountains of Oita in 1957, and the population is treated as extinct. Range is expanding and contracting at the same time in different places, which is one reason the rise in injuries cannot be read as a simple function of bear numbers.
Kaede’s Summary: Four Measures That Peaked in the Same Year
Set side by side, the charts point to the same year from four directions. Here are the three observations I would keep.
The question of how far bear attacks have risen has more than one answer, depending on which measure, which period and which geographic unit is used. Rather than rank those readings, it is more useful to set out what each of them shows.
Read together, the sense that the situation has become serious rests on more than the 13 deaths recorded in FY2025. Injuries at 4.3 times their FY2008 level, sightings at 4.6 times their FY2022 level, captures at 9.9 times their FY2008 level and a range roughly twice its 1978 extent are four separate movements that converged on the same fiscal year.
Which of them carries most weight depends on the measure, the period and the geographic unit chosen. That dependence is itself the clearest description of the current picture.
Frequently Asked Questions
When reading these charts, check three things together: where the series starts, what geographic unit is used, and which measure is being plotted. The same phrase “highest on record” can describe quite different things.
Are bears more dangerous than other wildlife in Japan?
On deaths alone, hornets and wasps have long been the larger cause in Japan, with around twenty deaths a year in vital statistics, ahead of venomous snakes at a few. Bear deaths ran between one and six a year for most of the series. FY2025 changed the comparison: at 13 deaths, bears came close to the usual annual figure for hornets. Counting injuries rather than deaths, bears are well ahead of other wildlife, since 238 people were injured in FY2025.
Why is there so little data from before 2008?
A single national series compiled to one standard begins in FY2008. Before that, records sat with individual prefectures and police forces, and no continuous national count exists. Hokkaido kept detailed brown bear culling records from the 1960s, but Asiatic black bear data for the rest of the country was fragmentary. FY2004 and FY2006 are recorded as mass-sighting years, though on a different basis that cannot be joined to the current series.
What is the emergency shooting rule introduced in September 2025?
It came in through a revision of the Wildlife Protection and Management Act and lets a municipality authorise the shooting of a bear in a built-up area when it judges there is an imminent risk to people. Previously, discharging a firearm near housing was effectively ruled out by restrictions on shooting near roads and buildings. The ministerial meetings that began in October 2025 have been working on standard operating procedures, and municipalities are still preparing their own manuals.
🔍 About the Fact-Check for This Article
Japan in Data fact-checks its articles. The evidence for this page is set out below.