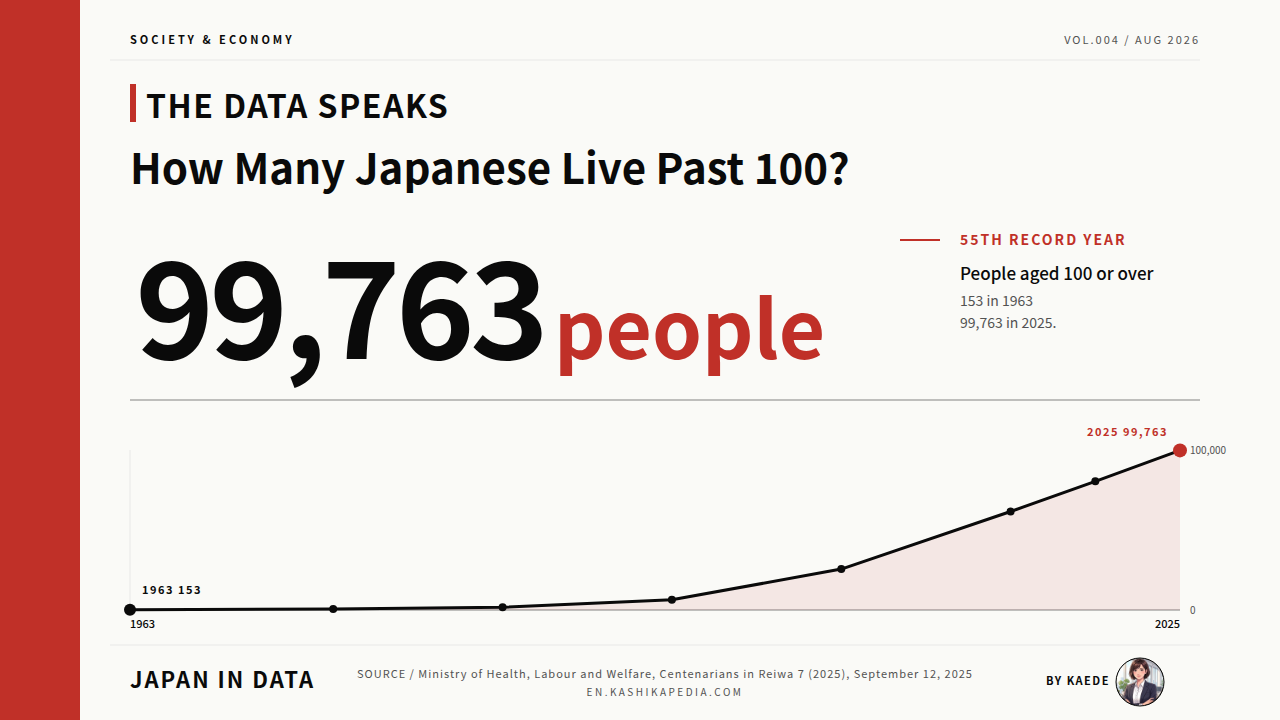

A count that starts at 153 and ends at 99,763 is hard to read as a table, so the 62-year series is drawn as a single curve first. The shape of the rise is the part worth looking at.
Japan counted 99,763 people aged 100 or over on September 1, 2025. When the government first compiled the figure in 1963, the total was 153. The count has risen in every year since 1971, a run of 55 consecutive record highs. Women account for 87,784 of the 2025 total, or 88.0 per cent, and the national rate is 80.58 centenarians for every 100,000 residents.
This article sets out what the Ministry of Health, Labour and Welfare and the Statistics Bureau publish on the subject: the annual series running from 1963, the number of years between each milestone count, the split between women and men, the rate in each of the 47 prefectures, and the distance between the prefectures with the largest counts and those with the highest rates.
Japan is divided into 47 prefectures, the administrative tier directly below the national government. Tokyo and Osaka are prefectures, and so are rural areas such as Shimane and Kochi. The centenarian figures on this page come from the Basic Resident Register, the municipal record of every registered resident. They are compiled as of September 1 each year, count people aged 100 or over on September 15, and exclude Japanese nationals living overseas. Population denominators are Statistics Bureau estimates for October 1, 2024.
How many people in Japan are aged 100 or over?
99,763 in 2025, against 153 when the count began in 1963.
This article was researched and edited by Kaede. Figures are current as of the date of writing. Statistics and official schemes are revised from time to time, so please check the official sources for the latest position. Kaede, Data Editor, Japan in Data. Based in Saitama, Japan.
- From 153 to 99,763: the count since 1963
- 18, 17, 14, then 13 years between the milestones
- Women are 88.0 per cent of the total
- Shimane 168.69, Saitama 48.50: the rate in all 47 prefectures
- Tokyo has the largest count and the 43rd highest rate
- Kaede’s summary: four figures that frame the series
- Frequently asked questions
- About the Fact-Check for This Article
From 153 to 99,763: the count since 1963
Plotted on a single axis, the first three decades sit almost flat against the base line. That flatness is not an artefact of the scale; the totals really were in the hundreds.
*Compiled and edited by the Japan in Data editorial team based on official government statistics.
The first count, in 1963, found 153 people aged 100 or over across the whole country. The total passed 1,000 in 1981 and 10,000 in 1998. It reached 51,376 in 2012 and 95,119 in 2024, before arriving at 99,763 in 2025.
Measured end to end, the 2025 figure is about 652 times the 1963 figure, across 62 years. Only one year in the whole series, 1970, recorded a total lower than the year before it. Every year from 1971 onward has set a new high, which is what the ministry means when it describes 2025 as the 55th consecutive record.
The 2025 total sits 237 short of 100,000. Alongside it the ministry published a second figure: 52,310 people reached or were expected to reach the age of 100 during the 2025 fiscal year, 4,422 more than in the year before.
18, 17, 14, then 13 years between the milestones
A curve shows the direction but not the pace. Laying the four milestone gaps side by side puts the pace in years, which is easier to compare.
*Compiled and edited by the Japan in Data editorial team based on official government statistics.
It took 18 years for the count to move from 153 in 1963 to 1,072 in 1981, and a further 17 years to reach 10,158 in 1998. The step from there to 51,376 took 14 years, and the step from 51,376 to 99,763 took 13.
The multiples attached to those steps fall as the spans shorten. The first step multiplied the count by about 7.0, the second by about 9.5, the third by about 5.1 and the fourth by about 1.9. The count is still adding more people each year while the rate of multiplication comes down.
In absolute terms the recent additions are the largest in the series. The 2025 total is 4,644 higher than the 2024 total. For comparison, the entire count in 1994 was 5,593, so a single recent year’s increase is close to the whole national total three decades ago.
Women are 88.0 per cent of the total
The share of women is one of the few figures in this series that has moved in both directions, so it is drawn as its own line rather than folded into the totals.
*Compiled and edited by the Japan in Data editorial team based on official government statistics.
Women made up 86.9 per cent of the 153 people counted in 1963. The share then fell through the 1970s and early 1980s, reaching 77.8 per cent in 1984, the lowest point in the series. It rose again from the late 1980s and passed 88 per cent in 2018.
The high point so far is 88.6 per cent, recorded in 2022 and again in 2023. In 2025 the share was 88.0 per cent, made up of 87,784 women and 11,979 men. That works out at about 7.3 women for every man aged 100 or over.
The same ministry table records life expectancy at birth alongside the counts. In 1963 it stood at 67.21 years for men and 72.34 for women. In the 2024 abridged life table, the most recent year shown, the figures were 81.09 and 87.13.
Shimane 168.69, Saitama 48.50: the rate in all 47 prefectures
Prefecture populations differ by a factor of more than 25, so the raw counts are set aside here and the map shows the count divided by population.
*Compiled and edited by the Japan in Data editorial team based on official government statistics.
Measured per 100,000 residents, the national figure is 80.58. Shimane records the highest rate at 168.69, followed by Kochi at 157.16 and Tottori at 144.63. Saitama records the lowest at 48.50, with Aichi at 53.00 and Osaka at 55.44.
The gap between the highest and lowest prefecture is about 3.5 times. The six lowest rates all belong to prefectures in or adjoining the Tokyo and Nagoya and Osaka metropolitan areas: Saitama, Aichi, Osaka, Chiba, Tokyo and Kanagawa. The highest rates cluster in the west and in prefectures with smaller populations.
Nagano is the exception to that pattern among the larger prefectures. It has a population of about 1.99 million and a rate of 133.92, fifth highest in the country. Hokkaido, with about 5.04 million residents, sits close to the national figure at 102.26.
Tokyo has the largest count and the 43rd highest rate
Counts and rates rank the same 47 prefectures in almost opposite orders, so this figure shows the ten largest counts with each prefecture’s position on the rate.
*Compiled and edited by the Japan in Data editorial team based on official government statistics.
Tokyo records 8,150 people aged 100 or over, the largest count of any prefecture and about 8.2 per cent of the national total. Kanagawa follows with 5,386 and Hokkaido with 5,157. Saitama, ninth by count with 3,556, ranks 47th on the rate.
Nine of the ten largest counts belong to prefectures ranked 31st or lower out of 47 on the rate. Hokkaido, 26th on the rate, is the one exception. Shimane, which has the highest rate in the country, has 1,083 centenarians in total and ranks 34th by count.
The two measures answer different questions. The count reflects how many people live in a prefecture as well as how old they are, while the rate removes the size of the population from the comparison. Both come from the same ministry table.
Kaede’s summary: four figures that frame the series
Read together, the four figures on this page describe a count that has grown for 55 straight years, is composed overwhelmingly of women, and varies widely by prefecture once population is taken into account.
The first figure is 99,763, the 2025 count, against 153 in 1963. The second is 55, the number of consecutive years in which the count has set a record. The third is 88.0 per cent, the share of the total who are women. The fourth is the range from 168.69 to 48.50 per 100,000 across the prefectures.
Two of those four figures have moved in one direction throughout: the total and the run of record years. The other two have changed shape rather than simply grown. The share of women fell for two decades before rising again, and the prefectural spread has widened as the national total has risen.
The ministry publishes the count once a year, in September. On the current series, the 100,000 mark had not been crossed as of the 2025 release, which stood 237 below it.
Frequently asked questions
Three questions come up often enough about this dataset to be worth answering directly, all of them about how the count is put together.
Q1. Who exactly is counted as a centenarian in these figures?
People registered in Japan’s Basic Resident Register who are aged 100 or over as of September 15 of that year. The tally is compiled as of September 1 from reports by prefectures, designated cities and core cities. Japanese nationals living overseas are not included in the total of 99,763.
Q2. Why does the count differ from the number of people turning 100?
They measure different groups. The 99,763 figure covers everyone aged 100 or over, including people well past that age. The separate figure of 52,310 covers only those reaching 100 during the fiscal year, who receive a congratulatory letter from the prime minister.
Q3. Is the 2025 count the final version of the figure?
It is the figure published in the September 2025 release, compiled from reports received by September 4. The ministry publishes a new count each September, so a later release will supersede it rather than revise it in place.
About the Fact-Check for This Article
Japan in Data fact-checks its articles. The evidence used for this page is set out below.