
The question of where Japan sits in the world ranking has a short answer and a long one. The short answer is a single number. The long answer is which year that number belongs to, and how the table behind it is built.
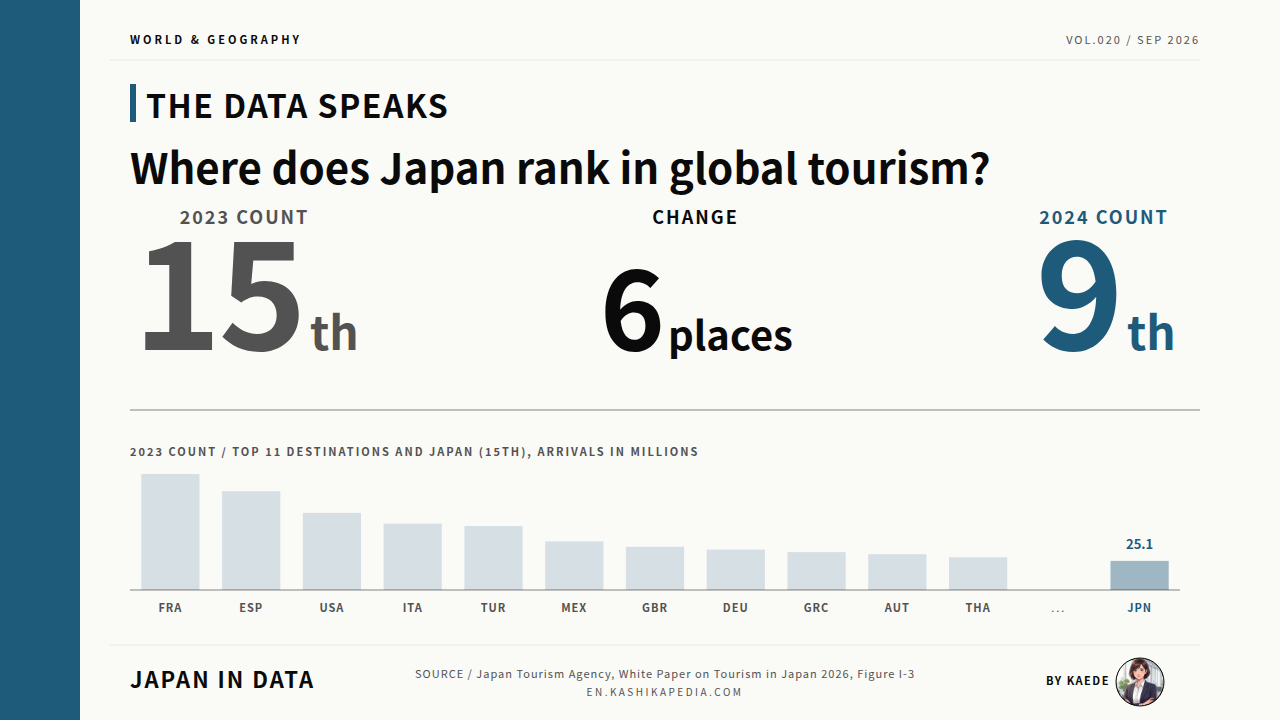
The Japan Tourism Agency publishes an annual ranking of destinations by the number of foreign visitors they receive. In the 2026 edition of the White Paper on Tourism, released in July 2026, the most recent count is for 2024. In that count Japan received 36.90 million visitors and placed 9th in the world, and 1st among destinations in Asia. The latest published ranking is the one for 2024, not for 2025.
The distinction matters because Japan set a new visitor record in 2025, with 42.68 million arrivals. No world ranking covering 2025 had been published as of September 2026. This article sets out how Japan’s position has moved since 2019, which countries appear above it, and the three mechanisms that make the figures in this kind of table change after publication.
Where does Japan sit in the world ranking of international visitor arrivals?
9th in the world in the 2024 count, and 1st among destinations in Asia.
Difference between the two counts6 places(15th to 9th)
Researched and edited by Kaede, Data Editor, Japan in Data. Based in Saitama, Japan. The figures were current at the time of writing. Statistics and official definitions are revised from time to time, so please check the original sources for the latest position.
How Japan’s Position Has Moved Since 2019
A ranking is easier to read as a path than as a list of years. Turning the world rank upside down, so that 1st sits at the top, shows the shape of the last six counts in one view.
Compiled and edited by the Japan in Data editorial team based on official government statistics.
Reading the four published points in order: Japan was 12th in the 2019 count with 31.88 million visitors, 42nd in 2022 with 3.83 million, 15th in 2023 with 25.10 million, and 9th in 2024 with 36.90 million. Between the 2023 and 2024 counts the position moved by six places, and against the 2019 count it is three places higher.
The 2020 and 2021 counts are not carried in the summary editions of the White Paper used here, so the chart leaves those two years empty rather than drawing a line through them. The 2019 figure comes from a table compiled by the Japan National Tourism Organization from UNWTO data, which is a secondary source rather than the White Paper itself.
Which Countries Appear Above Japan
The country by country breakdown is published with a lag. The most recent year for which every entry in the table is available is 2023, so the names and the spread are read from that year.
Compiled and edited by the Japan in Data editorial team based on official government statistics.
In the 2023 count France led with 100.0 million visitors, followed by Spain with 85.2 million and the United States with 66.5 million. Japan sat 15th with 25.10 million. France received about four times as many visitors as Japan in that year, and the ten places above Japan were held by eight European destinations and two in the Middle East.
Thailand, at 28.2 million, was the only Asian destination above Japan in the 2023 table. In the 2024 count published a year later, Japan is listed 1st in Asia. The country level figures behind that 2024 position are printed as an image in the summary edition, so the breakdown below is given for 2023, the most recent year with a full published list.
The full list of 40 destinations is set out below. The regional tabs are a grouping made by our editorial team for reading convenience, not a classification used by the source. The White Paper itself marks only which entries belong to Asia.
Top 40 destinations by international visitor arrivals, 2023 count
| Rank | Destination | Million visitors |
|---|---|---|
| 1 | France | 100.0 |
| 2 | Spain | 85.2 |
| 3 | United States | 66.5 |
| 4 | Italy | 57.2 |
| 5 | Türkiye | 55.2 |
| 6 | Mexico | 41.9 |
| 7 | United Kingdom | 37.2 |
| 8 | Germany | 34.8 |
| 9 | Greece | 32.7 |
| 10 | Austria | 30.9 |
| 11 | Thailand | 28.2 |
| 12 | United Arab Emirates | 28.1 |
| 13 | Saudi Arabia | 27.4 |
| 14 | Portugal | 26.5 |
| 15 | Japan | 25.1 |
| 16 | Netherlands | 20.3 |
| 17 | Malaysia | 20.1 |
| 18 | Poland | 19.0 |
| 19 | Canada | 18.3 |
| 20 | Hong Kong | 17.2 |
| 21 | Croatia | 16.9 |
| 22 | Egypt | 14.9 |
| 23 | Morocco | 14.5 |
| 24 | Macao | 14.2 |
| 25 | Hungary | 12.9 |
| 26 | Viet Nam | 12.6 |
| 27 | Switzerland | 11.1 |
| 28 | Republic of Korea | 11.0 |
| 29 | Albania | 9.7 |
| 30 | Tunisia | 9.4 |
| 31 | Belgium | 9.3 |
| 32 | Kyrgyzstan | 8.6 |
| 33 | South Africa | 8.5 |
| 34 | Dominican Republic | 8.1 |
| 35 | Sweden | 7.5 |
| 36 | Argentina | 7.3 |
| 37 | Australia | 7.2 |
| 38 | Uzbekistan | 6.6 |
| 39 | Taiwan | 6.5 |
| 40 | Ireland | 6.3 |
| Rank | Destination | Million visitors |
|---|---|---|
| 1 | France | 100.0 |
| 2 | Spain | 85.2 |
| 4 | Italy | 57.2 |
| 5 | Türkiye | 55.2 |
| 7 | United Kingdom | 37.2 |
| 8 | Germany | 34.8 |
| 9 | Greece | 32.7 |
| 10 | Austria | 30.9 |
| 14 | Portugal | 26.5 |
| 16 | Netherlands | 20.3 |
| 18 | Poland | 19.0 |
| 21 | Croatia | 16.9 |
| 25 | Hungary | 12.9 |
| 27 | Switzerland | 11.1 |
| 29 | Albania | 9.7 |
| 31 | Belgium | 9.3 |
| 35 | Sweden | 7.5 |
| 40 | Ireland | 6.3 |
| Rank | Destination | Million visitors |
|---|---|---|
| 11 | Thailand | 28.2 |
| 15 | Japan | 25.1 |
| 17 | Malaysia | 20.1 |
| 20 | Hong Kong | 17.2 |
| 24 | Macao | 14.2 |
| 26 | Viet Nam | 12.6 |
| 28 | Republic of Korea | 11.0 |
| 32 | Kyrgyzstan | 8.6 |
| 38 | Uzbekistan | 6.6 |
| 39 | Taiwan | 6.5 |
| Rank | Destination | Million visitors |
|---|---|---|
| 3 | United States | 66.5 |
| 6 | Mexico | 41.9 |
| 19 | Canada | 18.3 |
| 34 | Dominican Republic | 8.1 |
| 36 | Argentina | 7.3 |
| Rank | Destination | Million visitors |
|---|---|---|
| 12 | United Arab Emirates | 28.1 |
| 13 | Saudi Arabia | 27.4 |
| 22 | Egypt | 14.9 |
| 23 | Morocco | 14.5 |
| 30 | Tunisia | 9.4 |
| 33 | South Africa | 8.5 |
| Rank | Destination | Million visitors |
|---|---|---|
| 37 | Australia | 7.2 |
Compiled and edited by the Japan in Data editorial team based on official government statistics.
The Same Year’s Figures Change After Publication
Two editions of the same publication, six months apart, carry different numbers for the same years. Placing the two series on one pair of lines makes the size of the revisions visible.
Compiled and edited by the Japan in Data editorial team based on official government statistics.
UN Tourism put world international tourist arrivals for 2025 at 1,523 million in its January 2026 edition. In the May 2026 edition, revised in July, the same year is given as 1,546 million. The 2025 figure moved by 23 million between the two editions, and the annual growth rate printed alongside it moved from 4.0 per cent to 5.0 per cent.
The revisions are not confined to the most recent year. The 2023 total moved from 1,322 million to 1,336 million, and the 2024 total from 1,465 million to 1,472 million. Our calculation: the 23 million added to the 2025 total is about 54 per cent of Japan’s entire visitor count for the same year, 42.68 million.
The White Paper sets out the reasons its own table can move. Three notes carry the point directly: figures are provisional as of a stated month, each country counts arrivals under its own rules, and destinations that have not released a number are either carried forward or left out. The three cards below reproduce those notes.
When the count was taken
The figures in the table are provisional as of January 2026. The source notes that numbers may be released later or updated retroactively, so the order can change depending on when the values were taken.
How each country counts
Arrival figures are produced and published under statistical rules that differ from country to country. The values used are, with some exceptions, visitors who stayed at least one night.
Who is not in the table
Destinations without a 2024 figure are entered at their 2023 value. China, Denmark and Russia had no 2023 figure and are not carried at an earlier value, so they do not appear in the table at all.
2025 Brought 42.68 Million Visitors, and No Ranking Yet
The visitor count and the ranking table are two different series, released on different schedules. Setting them side by side keeps the record year and the missing ranking from being read as one fact.
Compiled and edited by the Japan in Data editorial team based on official government statistics.
Japan recorded 42.68 million visitors from abroad in 2025, an increase of 15.8 per cent on the previous year and the highest figure in the series. Our calculation: that works out at about 117,000 arrivals a day, and about 1.34 times the 2019 total of 31.88 million. No world ranking covering the 2025 count had been published as of September 2026.
The wider picture for 2025 comes from UN Tourism rather than from Japan. World arrivals reached 1,523 million on the January 2026 reading, a record for the years after the pandemic. The figures by region below are taken from that same edition, so they sit on one consistent reading rather than mixing the two versions.
Compiled and edited by the Japan in Data editorial team based on official government statistics.
Europe accounted for 793.5 million arrivals in 2025 and the Middle East for 99.8 million, which is 39 per cent above its 2019 level. Asia and the Pacific recorded 330.7 million and remains 9 per cent below 2019, the only region on this reading still short of its pre-pandemic figure. UN Tourism reports growth of 17 per cent for Japan over the first eleven months of 2025.
For the demand side of the same period, our article on what visitors to Japan spend by country of origin sets out the consumption figures that sit behind these arrival counts.
Kaede’s Summary: One Number, Three Qualifications
Putting the charts together, the answer to the opening question holds, but it carries three qualifications. Here they are as three observations rather than as a conclusion.
The question was where Japan ranks. The published answer is 9th, and the material above sets out what that number does and does not cover. Rather than ranking the sources against each other, the three observations below record what each of them states.
Read together, the three observations point to the same reading. A rank is a statement about one table, taken at one moment, covering the countries that had filed a number by then. The answer to the opening question is 9th in the 2024 count. Which year, which edition and which set of countries are part of the answer, not footnotes to it.
Frequently Asked Questions
Three questions come up most often around this table. Each answer names the year and the publication the figure comes from.
Q1. Where did Japan rank in 2025?
No ranking covering the 2025 count had been published as of September 2026. The most recent published ranking is for 2024, in which Japan placed 9th in the world and 1st in Asia with 36.90 million visitors. Japan’s own visitor count for 2025 is 42.68 million, the highest figure in that series.
Q2. Which country receives the most international visitors?
In the 2023 count, the most recent year with a full published breakdown, France led with 100.0 million visitors, followed by Spain with 85.2 million and the United States with 66.5 million. These are provisional figures assembled by the Japan Tourism Agency from UN Tourism data as of January 2025.
Q3. Why do different sources give different numbers for the same year?
The White Paper states three reasons in its own notes: the values are provisional as of a stated month, statistical rules differ between countries, and destinations without a released figure fall out of the table. UN Tourism also revises its own world totals between editions. Checking which publication and which month a figure comes from is part of reading it.
🔍 About the Fact-Check for This Article
Japan in Data fact-checks its articles. The evidence for the figures on this page is set out below.