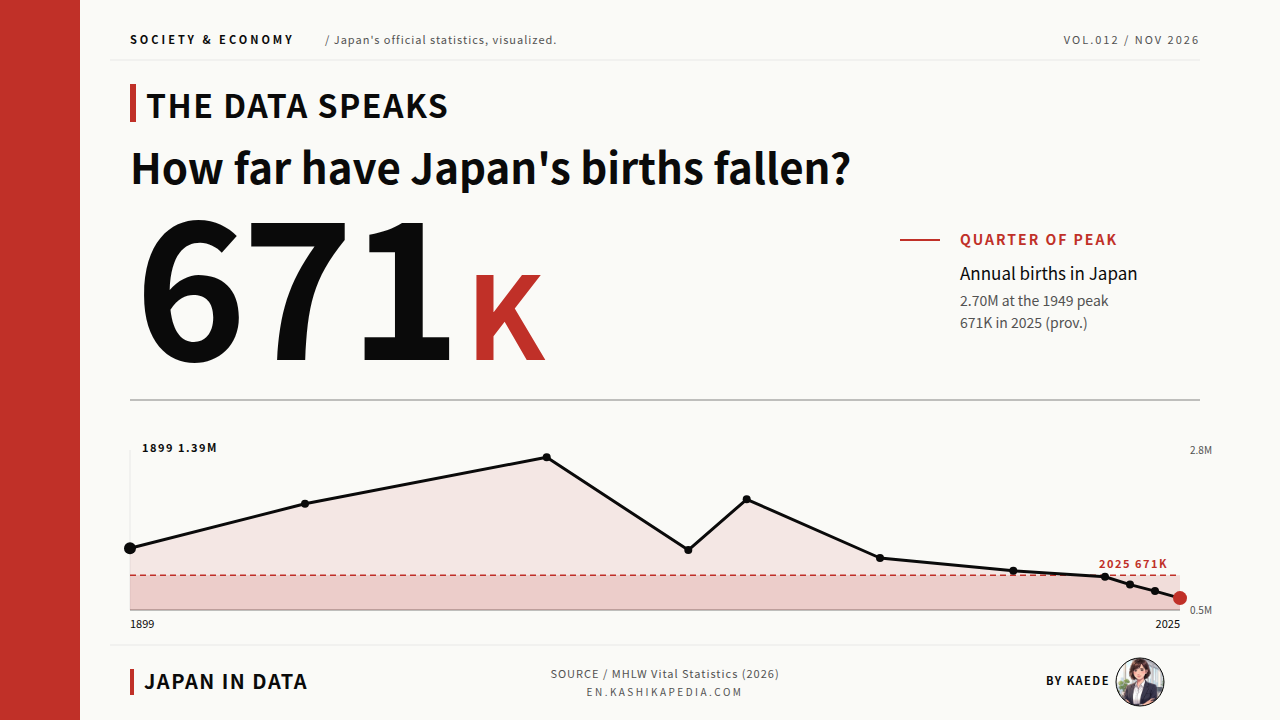

For a statistic that moves over long spans, like births, a 126-year line is a quicker route than single-year news. With the two peaks and the long descent that followed placed on one chart, the position of today’s figure of about 670,000 within the whole series becomes clear.
Japan’s births peaked at 2,696,638 in 1949 and have declined since, reaching 671,236 in 2025 (provisional figure). That total is the lowest since records began, a new record low for the 10th consecutive year. Births have fallen to about one quarter of the peak level (24.9%, our calculation). The figures come from the provisional Vital Statistics annual totals published by the Ministry of Health, Labour and Welfare on June 3, 2026.
This article uses the statistical tables (Tables 1 to 4) and the summary of results of the ministry’s Vital Statistics as primary sources. It sets out the full 126 years from 1899 to 2025 as a line chart, a timeline of thresholds crossed, and the shift in mothers’ age groups. It makes no forecasts and draws no conclusions about causes; it observes the trends the official data show.
Japan’s birth figures come from the Vital Statistics compiled by the Ministry of Health, Labour and Welfare (MHLW). The series used here counts births to Japanese nationals in Japan by calendar year. Figures for 2025 are provisional; final figures replace them later. The total fertility rate is the average number of children a woman would have over her lifetime at that year’s age-specific birth rates. Natural change is births minus deaths. Figures for 1947-72 exclude Okinawa Prefecture.
How far have births in Japan fallen?
To about one quarter of the peak, with a new record low for the 10th consecutive year.
Figures are current as of the time of writing. Statistics, rules and services are subject to change, so please check the official sources for the latest information.
- Births in Japan Over 126 Years, 1899 to 2025
- Two Baby Booms and Hinoeuma: 1949, 1973 and 1966
- Timeline of Thresholds: From 2 Million to 700,000
- The Shifting Age of Mothers: 1985, 2005 and 2025
- Related Indicators: A Fertility Rate of 1.14 and a Natural Decrease of 918,000
- Kaede’s Summary: Three Observations From the 126-Year Series
- Frequently Asked Questions
- 🔍 About the Fact-Check for This Article
Births in Japan Over 126 Years, 1899 to 2025
Drawn as a single line, 126 years place the two peaks, the hinoeuma dip and the run of thresholds crossed since 2016 on one screen. The three missing years are left unconnected, so the gap in the data stays visible as it is.
* Compiled and edited by the Japan in Data editorial team based on official government statistics.
In 1899, the first year of the series, births numbered 1,386,981. The trend was upward from there, and in 1920 births passed 2 million for the first time, at 2,025,564. Before the war, births stayed at a high level of around 2 million a year. Data for 1944-46 are missing, owing to the loss of records in wartime damage, among other reasons.
The first baby boom came after the war, from 1947 to 1949. The 1949 total of 2,696,638 is the highest on record and has not been exceeded in 126 years. Births then declined, returned above 2 million during the second baby boom of 1971-74, and have not reached 2 million in any year since 1975.
In 2016, births fell below 1 million for the first time, at 977,242. A new record low has been set every year since. In 2024, births fell below 700,000 for the first time, at 686,173 (final figure), and in 2025 they were 671,236 (provisional figure). Figures for 1947-72 do not include Okinawa.
Two Baby Booms and Hinoeuma: 1949, 1973 and 1966
The heights of the peaks are easier to compare as three bars. Here the tops of the first and second baby booms and the 2025 figure sit on the same scale.
* Compiled and edited by the Japan in Data editorial team based on official government statistics.
During the first baby boom (1947 to 1949), births exceeded 2.6 million for three years in a row, reaching 2,696,638 at the 1949 peak. The second baby boom (1971-74) peaked in 1973 at 2,091,983, about 600,000 lower than the first. The 2025 total of 671,236 (provisional) equals 24.9% of the first peak and 32.1% of the second (both our calculations).
Between the two booms lies 1966, a hinoeuma (fire horse) year in the traditional zodiac calendar. Births that year were 1,360,974, a single-year drop compared with 1,823,697 the year before and 1,935,647 the year after. A one-year dip of more than 400,000 below the years on either side appears only in this year across the 126-year series.
Timeline of Thresholds: From 2 Million to 700,000
Laying out the years each threshold was crossed as a staircase shows how the intervals have narrowed. Going from 1.5 million to 1 million took 32 years; going from 1 million to 700,000 took only 8.
* Compiled and edited by the Japan in Data editorial team based on official government statistics.
Listing the years births fell below key thresholds, they dropped below 2 million in 1975, after the second baby boom, and below 1.5 million in 1984. Births had already fallen under 2 million once in 1953 before returning above that level during the second baby boom, so the chart uses 1975 as its starting point.
The pace changed after births fell below 1 million in 2016. They went below 900,000 in 2019, 800,000 in 2022 and 700,000 in 2024, crossing one threshold after another. Going from below 1.5 million to below 1 million took 32 years, while going from below 1 million to below 700,000 took 8 years.
The Shifting Age of Mothers: 1985, 2005 and 2025
Which age groups births come from shows most clearly as 100% stacked bars, where the centre of gravity can be seen moving. Over 40 years, the middle of the bar shifts to the right.
* Compiled and edited by the Japan in Data editorial team based on official government statistics.
By mother’s age in five-year groups, the largest group in 1985 was 25 to 29, with 682,885 births, or 47.7% of the total (our calculation). By 2005 the largest group had become 30 to 34 (404,700 births, 38.1%), and in 2025 (provisional) the 30 to 34 group remains the largest, with 255,665 births and a 38.1% share.
Births to mothers aged 40 to 44 rose about fivefold, from 8,224 in 1985 to 41,631 in 2025. In 2025, the only age group with more births than the year before was 30 to 34, up 2,221. The mean age of mothers at first birth was 25.7 in 1975 and 31.0 in 2025. Over 40 years, the largest group moved from ages 25 to 29 to ages 30 to 34, and the mean age rose by a little over five years.
Related Indicators: A Fertility Rate of 1.14 and a Natural Decrease of 918,000
Next to the birth count, two more indicators are placed for observation, one a rate and one a difference: the total fertility rate, shown as a line, and natural change, which is births minus deaths.
* Compiled and edited by the Japan in Data editorial team based on official government statistics.
The total fertility rate fell from 4.54 in 1947, dropping to 1.58 in the hinoeuma year of 1966. It was 1.57 in 1989 and fell to 1.26 in 2005, before recovering to 1.45 in 2015. In 2025 it was 1.14 (provisional). That was the 10th consecutive annual decline and the lowest rate since records began.
* Compiled and edited by the Japan in Data editorial team based on official government statistics.
In 2025, deaths numbered 1,589,489 (provisional), exceeding the 671,236 births by 918,253. Natural change, births minus deaths, was a decrease of 918,253, negative for the 19th consecutive year. By birth order, there were 319,158 first births, 240,281 second births and 111,797 third or later births.
Kaede’s Summary: Three Observations From the 126-Year Series
With the 126-year line, the thresholds and the age structure all laid out, the facts the figures show can be grouped into three points.
To the question of how far births in Japan have fallen, the charts in this article have shown the trend from three angles: the 126-year series, the intervals between thresholds, and the age structure of mothers. Without assessing causes or policies, the points below are set out as observations drawn from the official data.
Taken together, the three observations place the current birth count not as a single-year drop but as the latest point on a downward slope that has run for half a century within the 126-year series. A level of about one quarter of the peak and narrowing intervals between thresholds are occurring at the same time, and this is the core observation on births as of 2025. The 2025 figures are provisional and can be checked again against the final figures scheduled for September 2026.
Frequently Asked Questions
When reading birth statistics, check two points: the difference between provisional, final and preliminary figures, and the breaks in the series (missing years and Okinawa). The same “2025 births” can take different values depending on which figure is meant.
Q1. How Do Provisional, Final and Preliminary Figures Differ?
The preliminary count (705,809 for 2025, published February 2026) is a notification-based total that includes, for example, foreign nationals born in Japan. The provisional figure (671,236, published June 2026) is the monthly annual total limited to Japanese nationals in Japan, and this article uses that series. Final figures apply small revisions to the provisional ones; the 2025 counts are scheduled for September 2026. Because the definitions differ, the 2025 preliminary and provisional figures are about 35,000 apart.
Q2. What Is Hinoeuma?
Hinoeuma (fire horse) is a year in the traditional East Asian zodiac cycle; the most recent was 1966. Births that year were 1,360,974, a single-year dip of more than 460,000 below the previous year. How births turn out in 2026, the next hinoeuma year, can be checked once the statistics are published.
Q3. Since When Have Births Been Recorded?
The annual series of the Ministry of Health, Labour and Welfare’s Vital Statistics begins in 1899, and 126 years of data through 2025 have been published. Data for 1944-46 are missing owing to the loss of records in wartime damage, among other reasons, and figures for 1947-72 exclude Okinawa. Long-term comparisons need to take these breaks and differences in coverage into account.
🔍 About the Fact-Check for This Article
Japan in Data fact-checks its articles. The evidence behind the fact-check for this page is set out below.