
People often speak of times when unemployment was high or low, but the benchmark behind those labels is rarely made clear. Drawing the annual averages since 1953 as one continuous line shows exactly where today’s figure sits.
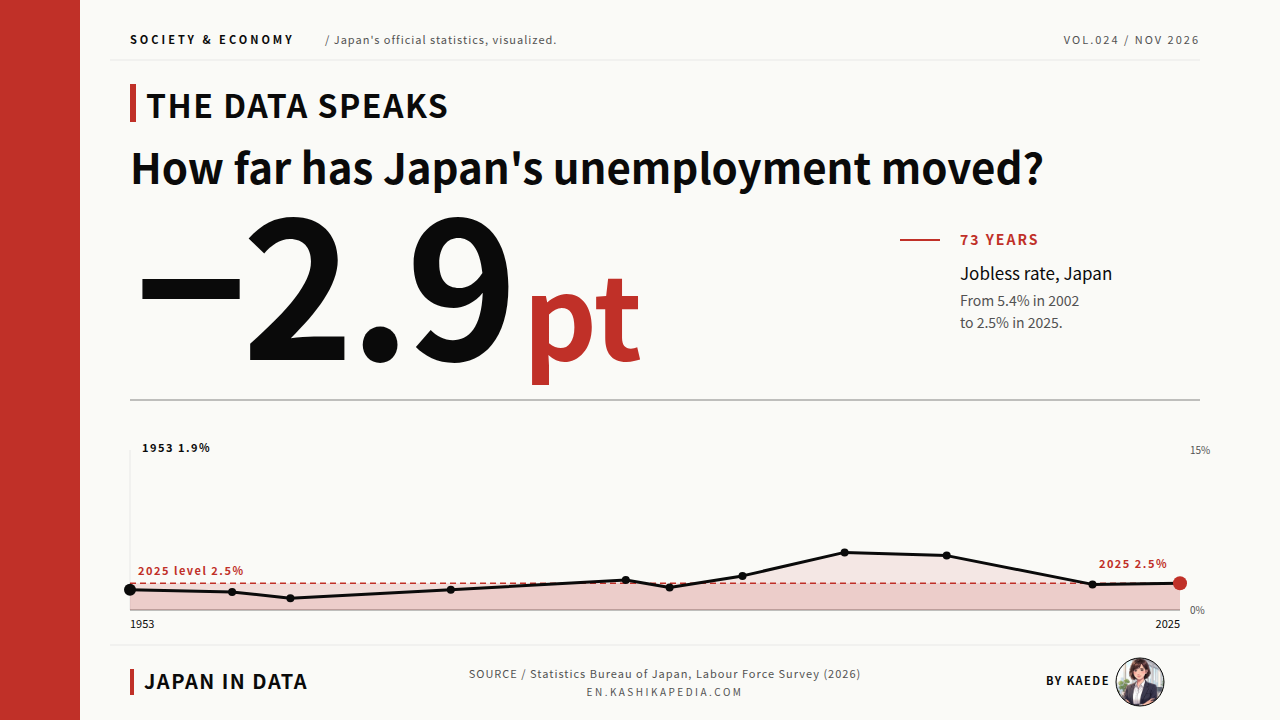
Japan’s unemployment rate averaged 2.5% in 2025, the same as the year before. The annual series in the Labour Force Survey of the Statistics Bureau of Japan runs back to 1953. Across these 73 years, the highest reading was 5.4% in 2002 and the lowest was 1.1%, recorded in 1964, 1969 and 1970. Over 73 years the range is 4.3 points, and the 2025 rate of 2.5% sits toward the lower end of it.
In 2025 there were 1.76 million unemployed people in a labor force of 70.04 million. Dividing the labor force by the number of unemployed gives 39.8, or roughly 1 in 40 people willing to work being unemployed (our calculation). In 2002, the record year, 3.59 million people were unemployed in a labor force of 66.89 million, about 1 in 19.
This article sets out, in charts of the same design, 73 years of the unemployment rate and the number of unemployed, 58 years by age group, the differences across 11 regions in 2025, and 11 years by reason for seeking work. All figures are annual averages of original data, a different series from the monthly seasonally adjusted rate often cited in the news. Because the way a series is built affects how it reads, its nature is set out first.
Japan’s unemployment figures come from the Labour Force Survey, a monthly household survey run by the Statistics Bureau of Japan under the Ministry of Internal Affairs and Communications. A person counts as unemployed only if they did no work during the survey week, could start work immediately, and were looking for work. The labor force is the employed plus the unemployed. Figures in this article are calendar-year annual averages of original (not seasonally adjusted) data. Regional figures use the survey’s 11 regional blocks, not prefectures.
How far has Japan’s unemployment rate moved over 73 years?
Japan’s unemployment rate averaged 2.5% in 2025. The record high was 5.4% in 2002.
Source: Statistics Bureau of Japan, Labour Force Survey (Basic Tabulation), 2025 Average Results (released January 30, 2026)
* Compiled and edited by the Japan in Data editorial team based on official government statistics.
Information is current as of the time of writing. Figures, rules and services are subject to change, so please check the official sources for the latest information.
- 73 Years of the Unemployment Rate: From 1.9% in 1953 to 2.5% in 2025
- The Number of Unemployed Over 73 Years: Same 2.5%, Different Totals
- Unemployment by Age Group: Gaps Across 58 Years Since 1968
- Unemployment by Region in 2025: Up to a 1.1-Point Gap Across 11 Regions
- Unemployed by Reason for Seeking Work: 750,000 Voluntary Leavers in 2025
- Kaede’s Summary: Three Observations From 73 Years of Unemployment Data
- Frequently Asked Questions
- 🔍 About the Fact-Check for This Article
73 Years of the Unemployment Rate: From 1.9% in 1953 to 2.5% in 2025
Seventy-three years of unemployment rates read more clearly as a single line than as a table, with every peak and trough in place. The overall shape comes first: where the rate rose and where it fell.
* Compiled and edited by the Japan in Data editorial team based on official government statistics.
The unemployment rate was 1.9% in 1953. From the late 1950s through the 1960s the rate stayed in the 1% range, reaching 1.1% in 1964, 1969 and 1970. Six years recorded 1.2% or less: 1964, 1965, 1968, 1969, 1970 and 1971. The lowest levels in the 73-year series are concentrated in this period.
From the 1970s the level moved higher: 1.9% in 1975, 2.0% in 1980, 2.6% in 1985 and 2.1% in 1990. From the late 1990s the rate kept rising, to 4.1% in 1998, 4.7% in 1999 and 2000, and 5.0% in 2001. In 2002 it reached 5.4%, the highest value in the 73-year series.
After 2002 the rate declined, falling to 3.9% by 2007. It stood at 5.1% in 2009 and 2010; the five years at 5.0% or above were 2001, 2002, 2003, 2009 and 2010. After 3.6% in 2014 and 2.4% in 2019, the rate was 2.8% in 2020 and 2021, 2.6% in 2022 and 2023, and 2.5% in 2024 and 2025. A rate of 2.5% was also recorded in 1955, 1988 and 1993.
The Number of Unemployed Over 73 Years: Same 2.5%, Different Totals
Looking only at the rate, it is easy to miss the size of the base, the labor force. Plotting the number of unemployed on the same time axis brings out an outline slightly different from the shape of the rate.
* Compiled and edited by the Japan in Data editorial team based on official government statistics.
There were 750,000 unemployed people in 1953. The lowest count in the 73-year series was 540,000 in 1964, when the labor force stood at 47.1 million and the unemployment rate at 1.1%. The highest was 3.59 million in 2002, with a labor force of 66.89 million and a rate of 5.4%.
In 2025 the number of unemployed was 1.76 million, the same as the previous year. The labor force grew for a third straight year to 70.04 million, and the number of employed grew for a fifth straight year to 68.28 million. At the same 2.5% rate, the number of people differs when the base differs. The rate was also 2.5% in 1993, when 1.66 million were unemployed in a labor force of 66.15 million.
Set side by side, the rate and the count rise in the same shape from the late 1990s to the early 2000s. The low period of the 1960s, by contrast, shows a deep trough in the rate but stays within a narrow band in the 500,000s and 600,000s in the count. One percentage point covers a different number of people when the labor force is around 47 million than when it is in the 70 million range.
Unemployment by Age Group: Gaps Across 58 Years Since 1968
Figures by age group are available from 1968. Layering the six groups on one chart shows how far apart they sit, as the spacing between the lines.
* Compiled and edited by the Japan in Data editorial team based on official government statistics.
Unemployment rates by age group have been published since 1968. Across all 58 years, people aged 15 to 24 had the highest rate of any group. In 1968 their rate was 1.8%, 0.6 points above the overall rate of 1.2%. In 2003 it reached 10.1%, 4.8 points above the overall rate of 5.3%.
In 2025 the rate was 3.8% for ages 15 to 24, 3.3% for 25 to 34, 2.6% for 55 to 64, 2.3% for 35 to 44, 2.0% for 45 to 54 and 1.9% for 65 and over. The overall rate was 2.5%. The 1.3-point gap between ages 15 to 24 and the overall rate is the widest of the six groups.
The height and timing of the peaks differ by group. For ages 55 to 64, the highest rate was 5.9% in 2002; it fell to 2.1% in 2019 and stood at 2.6% in 2025. For ages 65 and over, the lowest was 0.4% in 1969 and 1970, and the highest was 2.6% in 2009. The overall line runs through the average position of these groups.
Unemployment by Region in 2025: Up to a 1.1-Point Gap Across 11 Regions
Regional figures are published for 11 areas. Adding one line for the national level to bars sorted from highest to lowest shows at a glance which regions sit above it and which sit below.
* Compiled and edited by the Japan in Data editorial team based on official government statistics.
Across the survey’s 11 regional blocks, the highest average rate in 2025 was in Okinawa at 3.2%, followed by Tohoku at 2.9% and Hokkaido at 2.8%. The lowest were Hokuriku and Shikoku at 2.1%, followed by Tokai at 2.2% and North Kanto and Koshin at 2.4%. The gap between Okinawa and Hokuriku or Shikoku was 1.1 points.
Compared with the previous year, the rate rose in six regions (Hokkaido, Tohoku, North Kanto and Koshin, Hokuriku, Tokai and Chugoku), fell in four (South Kanto, Kinki, Shikoku and Kyushu) and was unchanged in Okinawa. Three regions matched the national average of 2.5%: South Kanto, Chugoku and Kyushu. Prefecture-level unemployment rates are published separately each quarter as model estimates, so they are not covered in this article.
Unemployed by Reason for Seeking Work: 750,000 Voluntary Leavers in 2025
Not all unemployed people began looking for work for the same reason. Setting the three categories side by side shows which reason accounts for most of the rises and falls.
* Compiled and edited by the Japan in Data editorial team based on official government statistics.
Of the 1.76 million unemployed in 2025, 750,000 had left a job voluntarily (for their own reasons), 480,000 were new jobseekers and 410,000 had left a job involuntarily. Of the involuntary leavers, 190,000 left at mandatory retirement or the end of a contract, and 220,000 for reasons on the employer’s or business side. The total includes people whose reason is unknown, so the categories do not add up to it.
Over the 11 years from 2015, all three categories reached their lowest point in 2019, rose in 2020 and 2021, then declined again. In 2025 all three categories were unchanged from the previous year. Involuntary leavers moved from 650,000 in 2015 to 410,000 in 2025, and voluntary leavers from 900,000 to 750,000.
Kaede’s Summary: Three Observations From 73 Years of Unemployment Data
Taken together, the charts so far show the rate, the count, age, region and reason each reflecting the same years from a different angle. Here they are set out as three observations.
On the question of where Japan’s unemployment rate stands today, the charts in this article show that the answer shifts with the measure and the period chosen. By rate or by count, for the whole labor force or split by age and region, the same year of 2025 looks different. None of these views is the single correct one; what each one measures is set out below as observations.
Read together, the three observations show one indicator, the unemployment rate, carrying both changes in its base (the labor force) and the spread of its breakdowns by age and region. Changes in the series are easier to follow by looking at the base and breakdowns behind the 2.5% figure than at the value alone. The 73-year line serves as the longest available yardstick for that.
Frequently Asked Questions
An unemployment chart reads most clearly with three things checked together: the type of series, the period covered and the base. Under the same name, the reading changes when any one of these three changes.
Q1. Who Counts as Unemployed in Japan?
The Labour Force Survey counts as unemployed anyone who meets all three of the following conditions: they had no job and did no work at all during the survey week; they could start work immediately if a job were available; and they were looking for work or preparing to start a business during the survey week. People who want to work but are not looking are classed as not in the labor force. The definition follows the international standard of the ILO.
Q2. Why Does the Rate in the News Differ From This Article?
The two are different series. This article uses annual averages of original data, while the figure reported each month in the news is the monthly seasonally adjusted rate. Seasonal adjustment removes regular seasonal swings so that month-to-month movements can be compared. The 2025 average was 2.5%, and the seasonally adjusted rate for June 2026 was also 2.5%, but the two are built differently, so they are not mixed on the same line here.
Q3. Does This Article Cover Unemployment by Prefecture?
No. The regional unemployment rates in the Labour Force Survey’s basic tabulation go down to 11 regional blocks, from Hokkaido to Okinawa. Prefecture-level figures are published separately each quarter as model estimates, using a different method from the national and 11-region tabulations. This article charts only series of the same nature, so its regional chart covers the 11 regions only.
🔍 About the Fact-Check for This Article
Japan in Data fact-checks its articles. The evidence for the fact-check on this page is set out below.