
The quickest way into the question of how far road deaths have fallen in the 80 years since the war is a single line chart covering 77 years, from 1948 to 2025. The two peaks of Japan’s so-called traffic wars and the new low in 2025 sit on the same curve, alongside the main policy milestones.
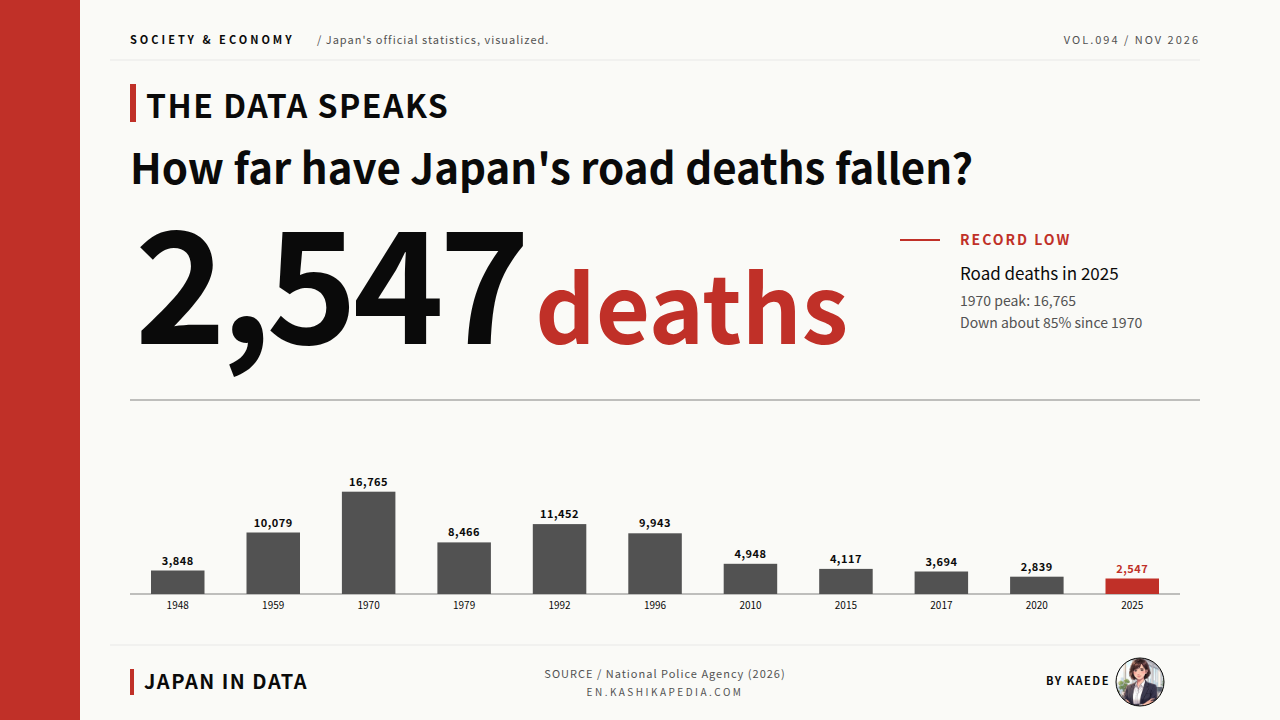
Road deaths in postwar Japan peaked at 16,765 in 1970 and have declined over the long run since then. According to National Police Agency traffic statistics, 2,547 people died in road accidents in 2025, the lowest figure since records began in 1948. The 1970 peak is about 6.6 times the 2025 total, a reduction of roughly 85%. The government target under the 11th Basic Traffic Safety Plan, 2,000 deaths or fewer by 2025, was not met. Deaths set a record low while falling short of that target.
This article draws on primary sources: the National Police Agency’s release on road deaths in 2025 (published January 6, 2026), the Cabinet Office’s White Paper on Traffic Safety 2025, and prefecture-level data on e-Stat, the government statistics portal. The figures are set out as a 77-year trend chart, a breakdown by road-user status, a 47-prefecture tile map, the long-run share of older people among the dead, and plan targets against results.
Japan’s road death figures come from the National Police Agency, which compiles reports from the 47 prefectural police forces. The headline measure counts people who die within 24 hours of a traffic accident; a separate 30-day count is used in international comparisons. Since 1971, the national government has set five-year Basic Traffic Safety Plans with numerical targets for deaths. Plan periods follow Japan’s fiscal year, which runs from April to March. Prefectures are Japan’s 47 top-level regions, from Tokyo to rural Akita. Other figures here follow the calendar year.
How far have road deaths fallen in the 80 years since the war?
From a peak of 16,765 in 1970 to 2,547 in 2025, a fall of about 85%.
Figures are current as of the time of writing. Statistics, rules and services are subject to change, so please check the official sources for the latest information.
- From 16,765 in 1970 to 2,547 in 2025: 77 Years of Road Deaths
- The First and Second Traffic Wars: What the Breakdown by Road User Shows
- Mapping 47 Prefectures: Road Deaths per 100,000 People in 2025
- Older People Rose From 16% to 56% of Road Deaths
- The Target of 2,000 or Fewer Was Missed: Results of the Last Four Plans
- Fatal Accidents by Type: Three Types Make Up About 66%
- Kaede’s Summary: Falling Deaths and an Ageing Profile Move Together
- Frequently Asked Questions
- 🔍 About the Fact-Check for This Article
From 16,765 in 1970 to 2,547 in 2025: 77 Years of Road Deaths
Seventy-seven years read more clearly as a yearly line than as a table in five-year steps. The peaks, the low points and the current level line up in one view: two peaks in 1970 and 1992, the drop below 10,000 in 1996, and the new low in 2025. Stretches of steep decline and stretches of increase alternate along the curve.
* Compiled and edited by the Japan in Data editorial team based on official government statistics.
When records began in 1948, 3,848 people died in road accidents in Japan. As car ownership spread rapidly, a process known in Japan as motorization, deaths rose year after year; the period is often described as one in which road safety measures did not keep pace. Deaths passed 10,000 for the first time in 1959, at 10,079, and in 1970 reached 16,765, the highest level of the postwar period. Between 1951 and 1970, deaths grew about 3.8 times. This stretch is known as the first traffic war.
The Basic Act on Traffic Safety Measures was enacted in 1970, and the first Basic Traffic Safety Plan began in 1971. Deaths entered a period of decline from that point. The first plan (1971 to 1975) made pedestrian safety its priority, and deaths fell to 8,466 by 1979. From the late 1980s they rose again, reaching 11,452 in 1992, the peak of what is called the second traffic war. Some observers link this rise to more young licensed drivers and a larger share of deaths among car occupants.
After 1992, deaths fell again over a period in which seat belt use rose, airbags spread and safety technology such as automatic emergency braking developed. In 1996 deaths fell to 9,943, below 10,000 for the first time in nine years. In 2017 they reached 3,694, then the lowest since records began, and in 2025 the figure of 2,547 set a new low. The 1970 peak is about 6.6 times the 2025 total, a reduction of about 85%.
The First and Second Traffic Wars: What the Breakdown by Road User Shows
The two traffic wars differ most clearly when the status of those who died is compared, not just the peak figures: walking, riding in a car, riding a motorcycle or riding a bicycle. Which groups rose and which fell shows where the changes came.
* Compiled and edited by the Japan in Data editorial team based on official government statistics.
The first traffic war (peak in 1970) and the second (peak in 1992) both saw more than 10,000 deaths a year, but the make-up of those deaths differed. In the 1970s, pedestrians were the largest group. Accounts of the period describe sidewalks, traffic signals and road signs as lagging behind the rapid growth in cars. The first plan set a goal of halving pedestrian deaths from the level projected for 1975, and pedestrian deaths fell to 3,732.
The second traffic war, from the late 1980s to the early 1990s, looked different. Pedestrian deaths remained high, but deaths of car occupants rose sharply. Some observers link this to a rapid increase in young licensed drivers and more high-speed and night-time driving. Seat belt use became mandatory on ordinary roads in 1985, front-seat belts were fully required there in 1992, and airbags and side airbags then became standard. By this account, the second wave was brought down largely through vehicle safety equipment, unlike the pedestrian-focused first.
In the year covered by the White Paper on Traffic Safety 2020, pedestrians made up 36.6% of road deaths, car occupants 33.7%, motorcyclists 16.3% and cyclists 13.5%. Pedestrians and car occupants together accounted for about 70%. The same pattern held in 2024, with pedestrians the largest group and car occupants second. Across the two traffic wars, deaths in each group have fallen, and the share of pedestrians among the dead is now rising again.
Mapping 47 Prefectures: Road Deaths per 100,000 People in 2025
Prefectures differ greatly in population, so raw death counts say little on their own. Set per 100,000 people, regional differences come into view. With all 47 prefectures on one tile map, the outline of the highest and lowest groups is easy to see.
* Compiled and edited by the Japan in Data editorial team based on official government statistics.
In 2025, the national average was 2.06 road deaths per 100,000 people. Shiga Prefecture recorded the highest rate at 3.85, followed by Kochi (3.81), Oita (3.78), Wakayama (3.75) and Akita (3.68). Tokyo recorded the lowest at 0.95, followed by Osaka (1.37), Aichi (1.50), Kanagawa (1.51) and Fukuoka (1.67). The rate in Shiga is about 4.1 times that in Tokyo, a wide regional gap in deaths relative to population.
Many of the higher-rate prefectures have large habitable areas, suburban road networks and long distances travelled by car. The lowest rates are in the metropolitan areas of Tokyo, Osaka, Aichi, Kanagawa and Fukuoka, where rail and bus use is high and driving distances are shorter. Some analysts read the prefectural rate as reflecting structural conditions such as population density, transport mode and road environment more than cultural factors such as driving manners.
Regional patterns change little from one year to the next. In 2024 the national average was 2.14 per 100,000 people, with Tokushima highest at 4.75 and Tokyo lowest at 1.04. The names at the top and bottom shifted between 2024 and 2025, but the broad pattern of lower rates in big metropolitan areas and higher rates elsewhere held. Averages over about five years show the regional structure more steadily than single years.
Older People Rose From 16% to 56% of Road Deaths
A single peak year does not show the whole picture for older people. Joining the 55 years from 1970 to 2025 into one line shows a long, steady climb. While total deaths fell, the share of older people moved in the opposite direction.
* Compiled and edited by the Japan in Data editorial team based on official government statistics.
In 1970, close to the first year of the first Basic Traffic Safety Plan (1971), people aged 65 and over made up 16.3% of all road deaths. The share was 31.6% in 1996, the first year of the sixth plan; 54.8% in 2016, the first year of the tenth; 56.2% in 2020; and 55.9% in 2025. Over 55 years, the share of older people among road deaths grew about 3.4 times. Total deaths fell by about 85% over the same span, while the older share more than tripled.
Commonly cited background factors start with the ageing of Japanese society as a whole: as the older population grows, so does the number of older people among road deaths. Older people are also reported to have a fatality rate about seven times that of other age groups when involved in accidents, with injuries more likely to be severe. National Police Agency data for 2024 put deaths per 100,000 older people at about twice the national average.
By road-user status, older people die as pedestrians more often than other age groups do, and accidents while crossing the road at night are prominent. According to National Police Agency data for 2024, pedestrian deaths per 100,000 people aged 80 and over were about 3.9 times the all-age average. The 12th Basic Traffic Safety Plan, scheduled to cover 2026 to 2030, is being drawn up against this background of a falling total and a rising older share.
The Target of 2,000 or Fewer Was Missed: Results of the Last Four Plans
Setting targets and results side by side for each plan shows the run of met and missed targets at a glance. Plans have been redrawn every five years, from the second plan in 1976 to the current eleventh. The figures for the last four plans are shown as bars below.
* Compiled and edited by the Japan in Data editorial team based on official government statistics.
Of the last four plans, only the 8th, covering FY2006 to FY2010 (April 2006 to March 2011), met its target. It aimed for 5,500 deaths or fewer by 2010, and the result was 4,948. The 9th plan (2011 to 2015) aimed for 3,000 or fewer by 2015; the result was 4,117. The 10th plan (2016 to 2020) aimed for 2,500 or fewer by 2020; the result was 2,839, a second consecutive miss.
The 11th plan (2021 to 2025) set targets for 2025 of 2,000 deaths or fewer, 2,400 or fewer deaths within 30 days, and 22,000 or fewer serious injuries. The 2025 result was 2,547 deaths within 24 hours, above the 2,000 target. The death target has now been missed in three consecutive plans since the 9th. The figures indicate a persistent gap between targets and results.
In a statement on January 6, 2026, Jiro Akama, Chairman of the National Public Safety Commission, acknowledged that the 11th plan’s target had not been met. He said he would direct the police to pursue, under the new 12th plan, measures including safety for pedestrians such as children and older people, traffic safety education on bicycle rules, and enforcement against drunk driving, phone use while driving and other dangerous violations. As of April 2026, the 12th plan’s targets were still being drafted by the Cabinet Office.
Fatal Accidents by Type: Three Types Make Up About 66%
Knowing where and how fatal accidents happen adds another layer. Arranged by type, the shares form a staircase: three large types at the top and smaller ones below. The top three alone account for about two-thirds of fatal accidents.
* Compiled and edited by the Japan in Data editorial team based on official government statistics.
By accident type, the largest category of fatal accidents in 2024 was head-on and similar collisions (combining head-on crashes, leaving the road and hitting roadside structures), at 30.5%. Pedestrians crossing the road followed at 22.7%, and right-angle collisions at junctions at 12.6%. Together, these three types made up about 66%, roughly two-thirds of fatal accidents. The rest were other vehicle-pedestrian accidents (8.4%), turning collisions (6.8%), rear-end collisions (4.9%) and other types (14.1%).
Head-on and similar collisions include crossing into the opposite lane, running off the road on curves and hitting utility poles or signs, and form the largest type on the vehicle side. Pedestrian crossing accidents occur often at night and involve a high share of older people. Right-angle collisions occur when vehicles meet at junctions without signals or when entering intersections, and are common on residential streets. The three types differ in both cause and location.
Over the past ten years, every type has declined per 100,000 people, but in 2024 head-on and similar collisions and turning collisions (excluding other vehicle-pedestrian accidents) rose from the previous year. Seat belt use stood at 94.9% in 2024, and the fatality rate for unbelted occupants was 14.0 times that for belted occupants. Accident types and the use of safety equipment together form the current picture of fatal accidents.
Kaede’s Summary: Falling Deaths and an Ageing Profile Move Together
Laid side by side, the long-run trend, the regional gaps and the breakdowns show the fall in road deaths running alongside several separate movements. They are set out below as three observations.
To the question of how far road deaths have fallen in the 80 years since the war, the charts in this article show a large long-run decline running in parallel with separate movements: an older age profile, regional gaps and missed targets. The time window, the measure and the age breakdown each tell a different story. The aim here is not to rank the data but to record those differences as observations.
One reading of the three observations is that road safety in Japan has shifted from reducing the overall total toward reducing deaths according to the vulnerabilities of particular age groups and road users. A large fall in deaths and a rising share of older people, along with missed targets and persistent regional gaps, are occurring at the same time. The answer to how far road deaths have fallen changes with the measure, the period and the age group examined.
Frequently Asked Questions
Three points help when reading traffic accident statistics: the difference between 24-hour and 30-day death counts, the breakdown by age group, and how far each plan reached. Change any one of the three and the same data tells a different story.
Q1. What Is the Difference Between Deaths Within 24 Hours and Deaths Within 30 Days?
All death figures in this article, such as 2,547, are National Police Agency counts of deaths within 24 hours: people who died within 24 hours of an accident. This measure has been used consistently since the war. The 30-day count includes people who died within 30 days and captures deaths more broadly. In 2024 it was 3,221, about 1.2 times the 24-hour figure of 2,663. IRTAD, the International Traffic Safety Data and Analysis Group, uses 30-day counts, so international comparisons rely on them.
Q2. Why Has the Share of Older People Risen So Far?
Commonly cited explanations involve three overlapping factors. First is the ageing of Japanese society: as the number of older people grows, so does the number involved in accidents. Second, older people are reported to have a fatality rate about seven times that of other age groups, with injuries more likely to be severe. Third, fewer young people hold driving licences, and safety equipment such as airbags and automatic braking is described as having reduced deaths among younger and middle-aged people, while reaching older pedestrians less directly.
Q3. What Are the Targets of the 12th Basic Traffic Safety Plan?
As of April 2026, the targets for the 12th Basic Traffic Safety Plan (scheduled for FY2026 to FY2030) were still being drafted. Materials from the transport ministry’s Council for Transport Policy (October 2025) showed draft targets of 1,900 or fewer deaths within 24 hours and 2,300 or fewer within 30 days, to be finalized after discussion at the Central Traffic Safety Policy Council. Priorities under discussion include pedestrian safety for children and older people, bicycle rule compliance (with traffic fines for cyclists from April 2026), and stronger enforcement against drunk driving and phone use while driving.
🔍 About the Fact-Check for This Article
Japan in Data fact-checks its articles. The evidence for the fact-check of this page is set out below.