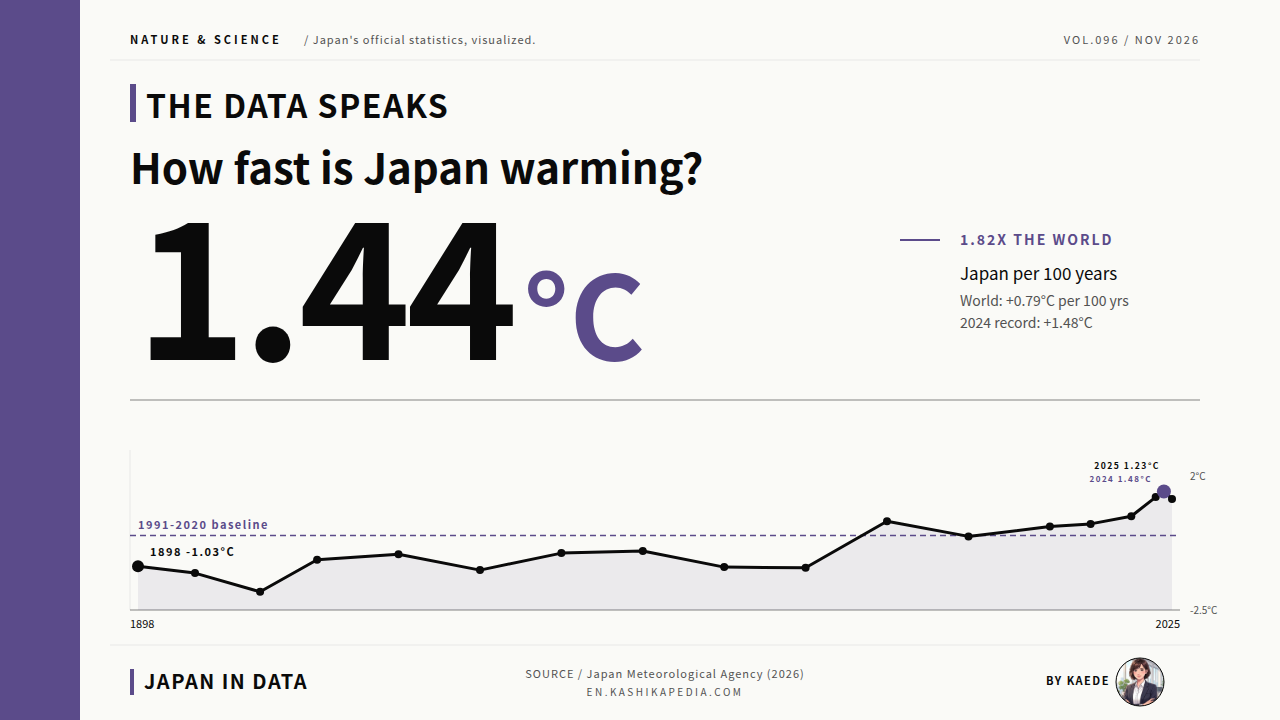

The quickest way into the question of how far global warming has gone is a chart that lays the annual mean temperatures of the world and of Japan over one common baseline. Adding a trend line per 100 years to each series shows at a glance how much faster Japan is warming than the world.
According to long-term trends published by the Japan Meteorological Agency (JMA), the world’s annual mean temperature has risen at a rate of +0.79°C per 100 years since 1891. Japan’s annual mean temperature has risen at +1.44°C per 100 years since 1898, about 1.82 times the global rate.
In 2024 the global annual mean temperature reached +1.55±0.13°C above pre-industrial levels, the first time a calendar year on record has passed 1.5°C. Japan’s seven warmest years on record all fall within the seven years from 2019 to 2025. In recent years, annual readings above the baseline have become the norm.
This article works from primary sources: the JMA’s annual mean temperature series for the world and for Japan, the World Meteorological Organization (WMO) report State of the Global Climate 2024, the GISTEMP v4 dataset of the NASA Goddard Institute for Space Studies, and Climate Change in Japan 2025 from the Ministry of Education, Culture, Sports, Science and Technology (MEXT) and the JMA.
The figures are set out in several charts: the world and Japan overlaid, six datasets compared, 100-year warming rates by major city, hot days, tropical nights and frost days, a milestone timeline, and CO2 overlaid with temperature. Setting the long-run global trend beside city-level differences within Japan gives two angles on where warming stands today.
The Japan Meteorological Agency (JMA) is Japan’s national weather and climate authority. It reports temperatures as anomalies, meaning the difference from a baseline average, and uses the 1991-2020 average as its baseline. The World Meteorological Organization (WMO) and the Intergovernmental Panel on Climate Change (IPCC) instead measure warming against the pre-industrial period, 1850 to 1900. Rates such as +0.79°C per 100 years are linear trends fitted to the full record. Temperatures are in degrees Celsius and figures follow the calendar year.
How far has global warming progressed?
The world is up 0.79°C per century. Japan is up 1.44°C, about 1.82 times faster.
Figures are current as of the time of writing. Statistics, rules and services are subject to change, so please check the official sources for the latest information.
- How Much Have World and Japan Temperatures Risen in 135 Years?
- How Do the 2024 Final Values From Six Datasets Differ?
- Where in Japan Is Warming Fastest? Major Cities and the National Average
- How Has Warming Changed Daily Life? Hot Days, Tropical Nights and Frost Days
- What Path Has Global Warming Taken? A Timeline of Key Milestones
- Do CO2 Concentration and Temperature Really Move Together?
- Kaede’s Summary: Read Baselines and Urbanization Separately to Compare World and Japan
- Frequently Asked Questions
- 🔍 About the Fact-Check for This Article
How Much Have World and Japan Temperatures Risen in 135 Years?
Overlaying world (1891-2025) and Japan (1898-2025) annual mean temperatures as anomalies from the same 1991-2020 baseline shows Japan (red) swinging more widely than the world (purple). Adding a trend line per 100 years to each series makes the difference in slope, about 1.82 times, easy to see.
* Compiled and edited by the Japan in Data editorial team based on official government statistics.
According to the JMA’s long-term trends, the world’s annual mean temperature has risen at +0.79°C per 100 years since 1891, while Japan’s has risen at +1.44°C per 100 years since 1898, about 1.82 times the global pace. According to the JMA, land areas in the mid-latitudes of the Northern Hemisphere, where Japan lies, tend to warm faster than the oceans.
Measured as anomalies from the 1991-2020 baseline, the 2024 annual mean stood at +0.63°C for the world and +1.48°C for Japan. Both were the highest readings on record. In 2025 the world stood at +0.48°C and Japan at +1.23°C, each the third highest, and years running about 1°C above the baseline have become common.
How Do the 2024 Final Values From Six Datasets Differ?
The 2024 global mean temperature is published as +1.55°C by the World Meteorological Organization, against the 1850-1900 pre-industrial baseline, and as +0.63°C by the JMA, against the 1991-2020 baseline. The two figures use different baselines. Aligning six datasets on one pre-industrial baseline in a bar chart lets them be compared directly.
* Compiled and edited by the Japan in Data editorial team based on official government statistics.
The WMO’s State of the Global Climate 2024, released on March 19, 2025, confirmed the 2024 global mean temperature at +1.55±0.13°C above pre-industrial levels, based on a composite of six datasets. These come from the WMO, the NASA Goddard Institute for Space Studies (GISTEMP v4), the US National Oceanic and Atmospheric Administration (NOAA), the UK Met Office Hadley Centre (HadCRUT5), Berkeley Earth and the JMA.
According to the IPCC, the offset for converting the JMA’s figure on the 1991-2020 baseline (+0.63°C) to a pre-industrial basis is about +0.69°C, with an uncertainty of ±0.12°C. The observations broadly agree across baselines, and the finding that 2024 ranks first on record holds under either one.
Where in Japan Is Warming Fastest? Major Cities and the National Average
Warming in Japan differs by location. A bar chart setting the JMA’s 11 major cities (statistics from 1929) beside the average of 15 sites with little urbanization and the world average gives an approximate view of the urbanization effect, including the urban heat island.
* Compiled and edited by the Japan in Data editorial team based on official government statistics.
According to the JMA’s heat island observations for 1929 to 2024, annual mean temperatures in 11 major cities rose at 2.2 to 3.4°C per 100 years. Tokyo is highest at 3.4°C, followed by Fukuoka (3.2°C), Nagoya (3.1°C), Yokohama (3.0°C), Sapporo and Kyoto (2.9°C), and Sendai, Osaka and Kagoshima (2.7°C).
The average of 15 sites where urbanization has relatively little effect is 1.8°C per 100 years. The JMA presents the gap between each city and that average as an approximate measure of urbanization, including the heat island effect, on top of global warming. Against the world average of 0.79°C per 100 years, Japan’s large cities are warming about 3 to 4 times as fast.
Seasonal timing also differs from place to place across Japan. A separate Japan in Data article draws on JMA observations of cherry blossom flowering to set out regional trends in flowering dates across the country. It applies the same approach used here: long-running official records, compared place by place over several decades.
How Has Warming Changed Daily Life? Hot Days, Tropical Nights and Frost Days
A rise of 0.5 to 1°C in the annual mean shows up in daily life as more hot days, extremely hot days and tropical nights, and fewer frost days. Comparing the four measures as 30-year averages from Climate Change in Japan 2025 shows how everyday conditions have changed.
* Compiled and edited by the Japan in Data editorial team based on official government statistics.
According to Climate Change in Japan 2025, published by MEXT and the JMA in March 2025, annual day counts averaged over 51 sites changed markedly between the earlier 30 years (1929-1958) and the recent 30 years (1995-2024). Tropical nights, when the daily minimum stays at 25°C or above, roughly doubled from about 12 to about 25 a year.
Frost days, when the daily minimum falls below 0°C, have decreased. Hot days, with a daily maximum of 30°C or above, and extremely hot days, at 35°C or above, have increased, with the rise most visible since the 1990s. The chart above sets out the averages for each of the four measures in both periods, so the direction of change can be read side by side.
Projections for the end of the 21st century, which depend on greenhouse gas emissions, put tropical nights at 26.4 days a year under a 2°C scenario and 56.2 days under a 4°C scenario. Both figures are model estimates published in the same report rather than observed values.
What Path Has Global Warming Taken? A Timeline of Key Milestones
Laying out roughly 150 years of watching the climate as a series of milestones (the industrial era baseline, the first warning, the Keeling Curve, the Kyoto Protocol, the Paris Agreement and the first year above 1.5°C) shows science and policy moving along the same time axis.
* Compiled and edited by the Japan in Data editorial team based on official government statistics.
The milestones run as follows. In 1896 Svante Arrhenius first set out a quantitative estimate of the greenhouse effect of carbon dioxide. In 1958 Charles Keeling began continuous measurements of atmospheric CO2 at Mauna Loa in Hawaii, a record now known as the Keeling Curve.
In 1988 the United Nations Environment Programme (UNEP) and the WMO jointly founded the Intergovernmental Panel on Climate Change (IPCC), placing warming on the international agenda. International frameworks followed with the Kyoto Protocol in 1997 and the Paris Agreement in 2015, with its 1.5°C goal. In 2024 the global annual mean temperature exceeded 1.5°C above pre-industrial levels for the first time.
Do CO2 Concentration and Temperature Really Move Together?
Overlaying WMO greenhouse gas data (CO2 concentration) with temperature anomalies for 1850 to 2024 shows both rising rapidly since industrialization. Ocean heat content has also set a new record in each of the eight years from 2017 to 2024.
* Compiled and edited by the Japan in Data editorial team based on official government statistics.
According to final WMO figures, the atmospheric CO2 concentration in 2023 was 420.0±0.1 ppm, about 151% of the pre-industrial level of about 280 ppm. CO2 has risen without interruption since the Keeling Curve began in 1958, and a further record was confirmed in 2024.
Set beside the temperature anomaly, the two series have moved together clearly since the 1950s. According to the WMO, the oceans absorb about 90% of the excess heat from global warming, and ocean heat content set a new record in each of the eight years from 2017 to 2024. CO2 concentration, temperature and ocean heat content serve as three separate indicators of warming.
Kaede’s Summary: Read Baselines and Urbanization Separately to Compare World and Japan
With the trends and regional differences laid side by side, the gap between warming in the world and in Japan becomes easier to read once baselines, observation periods and the urbanization effect are separated. The points below set this out as three observations.
On the question of how global warming is progressing, the charts in this article have shown that it can be observed along three axes: the gap between the world and Japan, differences in baseline, and the added effect of urbanization. The data are set out below as observations, without ranking one figure above another.
Read together, the three observations place 2024 as the first year the global annual mean passed 1.5°C above pre-industrial levels. According to the JMA, Japan’s faster warming is associated with its mid-latitude location, its land-based records and, in cities, urbanization. Observing the long-run global trend and regional differences within Japan on separate scales gives a clearer view of where warming stands.
Frequently Asked Questions
When reading a chart of rising temperatures, check three things together: the baseline period, the observation period and the effect of urbanization. The same data can tell a different story when any one of these three changes. The questions below take them in turn.
Q1. Why Is Japan Warming Faster Than the World?
According to the JMA, Japan lies in the mid-latitudes of the Northern Hemisphere and its records come from land areas, which warm faster than the oceans. Many of Japan’s observation sites are also in large cities, where urbanization, including the heat island effect, adds to global warming.
The JMA’s average for 15 sites with little urbanization is 1.8°C per 100 years (1929-2024), about 2.3 times the world average of 0.79°C. With the urbanization component added, large cities register higher rates still: 3.4°C in Tokyo, 3.2°C in Fukuoka and 3.1°C in Nagoya per 100 years.
Q2. Does Passing 1.5°C in 2024 Put the Paris Agreement’s 1.5°C Goal Out of Reach?
A single year above 1.5°C and the long-term goal are separate concepts. The WMO confirmed the 2024 global mean temperature at +1.55±0.13°C above pre-industrial levels, but the Paris Agreement’s 1.5°C goal is assessed on long-term averages of about 20 to 30 years. On that basis, the long-term average still stands at roughly +1.3°C.
2024 marks the first calendar year above 1.5°C. The past ten years, 2015 to 2024, are all among the ten warmest on record, and the long-term average has been moving toward 1.5°C at a fast pace. Against that pace, meeting the goal is often described as difficult.
Q3. How Does the 1991-2020 Baseline Differ From a Pre-Industrial Baseline?
Both are reference periods for measuring temperature anomalies, chosen for different purposes. The JMA uses the recent 30-year average (1991-2020) as its normal for everyday comparison. The IPCC and the WMO use the pre-industrial period (1850-1900) to measure the cumulative effect of warming.
According to the IPCC, the offset between the two is about +0.69°C. On that basis, the JMA’s 2024 global anomaly of +0.63°C converts to about +1.32°C above pre-industrial levels. The gap with the WMO six-dataset composite of +1.55°C is attributed to differences in calculation methods and datasets.
🔍 About the Fact-Check for This Article
Japan in Data fact-checks its articles. The evidence used to check the main figures and facts on this page is listed below, with a link to the official source behind each item and a note wherever a figure may be revised later.