
Tokyo’s population over the past century looks different once the single line is split into the 23 wards and the surrounding cities. Using 105 years of census figures, this article checks where the population has grown and where it has fallen.
Tokyo’s population reached 14,236,627 in the 2025 Population Census (final figures from the Ministry of Internal Affairs and Communications). That is about 3.8 times the 3,699,428 counted in 1920 and the highest census count on record. The 23 wards set a new high at 9,944,109. The 26 cities, at 4,217,326, recorded their first decline from a previous census since counting began in 1920.
Between 2020 and 2025 the population grew by 189,033, a pace of about 104 people a day. This article uses census populations as of October 1, grouped into the four areas the Tokyo Metropolitan Government publishes: the 23 wards, the 26 cities, the four towns and villages of Nishitama District, and the nine towns and villages of the Izu and Ogasawara Islands.
The 105 years from 1920 to 2025 are set out in five charts: the population year by year, the ward area against the city area, the share of residents living in the wards, the change by area since 2020, and the breakdown of the change during the single year of 2025.
Tokyo is one of Japan’s prefectures, the country’s top-level administrative regions. Officially called Tokyo Metropolis, it contains 23 special wards, 26 cities, four towns and villages in Nishitama District, and nine island towns and villages. The national Population Census, run by the Ministry of Internal Affairs and Communications, counts everyone living in Japan as of October 1 every five years. Between censuses, the metropolitan government publishes monthly estimates and annual figures based on the Basic Resident Register, the official record of residents. Japanese sources often round in man, units of ten thousand.
How has Tokyo’s population changed in 100 years, and where is it growing now?
14,236,627 in 2025, the highest census count. The wards grew to 9.94 million; the cities fell for the first time, to 4.22 million.
* Compiled and edited by the Japan in Data editorial team based on official government statistics.
Figures are current as of the time of writing. Statistics, rules and services are subject to change, so please check the official sources for the latest information.
- Tokyo’s Population Over 105 Years: From 3.7 Million to 14.24 Million
- Wards and Cities Took Different Paths: 30 Years of Decline vs. 15-Fold Growth
- How Many Tokyo Residents Live in the 23 Wards? 93% to 67%, Then 70%
- Where Did Tokyo Grow, 2020 to 2025? Wards Up 210,000, Cities Down 17,000
- Deaths Exceed Births, Yet Tokyo Grows: The 2025 Breakdown
- Kaede’s Summary: What 105 Years of Tokyo Population Data Show
- Frequently Asked Questions
- 🔍 About the Fact-Check for This Article
Tokyo’s Population Over 105 Years: From 3.7 Million to 14.24 Million
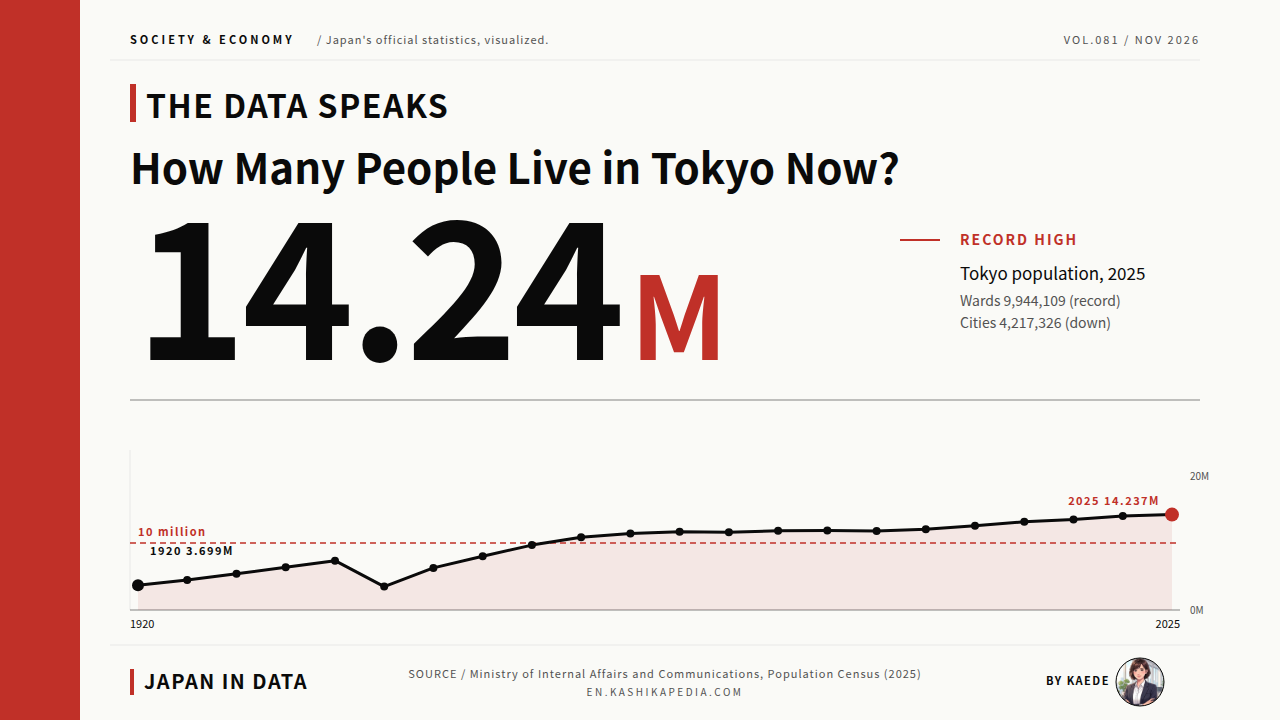
This line follows Tokyo’s population on October 1 of each year from 1920 onward. The 2025 point is the final census figure, so the whole century sits on a single scale.
* Compiled and edited by the Japan in Data editorial team based on official government statistics.
Tokyo’s population was 3,699,428 at the first Population Census in 1920. It rose to 7,354,971 by 1940, but the Population Survey of November 1, 1945 counted 3,488,284, a fall of 52.57% from 1940. The census population first passed the 1940 level again in 1955, at 8,037,084.
In the metropolitan government’s October 1 series, the population reached 10,180,203 in 1962, passing 10 million for the first time. In the census, it stayed between 11.6 million and 11.9 million from 1975 to 1995, slipping slightly below the previous count in 1980 and in 1995. Since 2000 it has risen at every census, reaching 14,236,627 in 2025.
Tokyo’s population by area in each census (people; 2025 final figures; * 1945 is the Population Survey of November 1)
| Year | Total | Wards | Cities | District | Islands |
|---|---|---|---|---|---|
| 1920 | 3,699,428 | 3,358,186 | 282,584 | 25,552 | 33,106 |
| 1925 | 4,485,144 | 4,109,113 | 316,308 | 26,311 | 33,412 |
| 1930 | 5,408,678 | 4,986,913 | 357,871 | 28,778 | 35,116 |
| 1935 | 6,369,919 | 5,895,882 | 405,686 | 28,802 | 39,549 |
| 1940 | 7,354,971 | 6,778,804 | 505,079 | 31,760 | 39,328 |
| 1945* | 3,488,284 | 2,777,010 | 641,890 | 41,176 | 28,208 |
| 1950 | 6,277,500 | 5,385,071 | 810,993 | 40,306 | 41,130 |
| 1955 | 8,037,084 | 6,969,104 | 987,934 | 39,446 | 40,600 |
| 1960 | 9,683,802 | 8,310,027 | 1,295,520 | 39,574 | 38,681 |
| 1965 | 10,869,244 | 8,893,094 | 1,898,529 | 42,029 | 35,592 |
| 1970 | 11,408,071 | 8,840,942 | 2,490,571 | 43,291 | 33,267 |
| 1975 | 11,673,554 | 8,646,520 | 2,945,600 | 47,447 | 33,987 |
| 1980 | 11,618,281 | 8,351,893 | 3,182,019 | 50,695 | 33,674 |
| 1985 | 11,829,363 | 8,354,615 | 3,385,056 | 56,105 | 33,587 |
| 1990 | 11,855,563 | 8,163,573 | 3,599,683 | 59,971 | 32,336 |
| 1995 | 11,773,605 | 7,967,614 | 3,712,682 | 61,232 | 32,077 |
| 2000 | 12,064,101 | 8,134,688 | 3,841,419 | 60,354 | 27,640 |
| 2005 | 12,576,601 | 8,489,653 | 3,998,901 | 59,303 | 28,744 |
| 2010 | 13,159,388 | 8,945,695 | 4,127,128 | 58,750 | 27,815 |
| 2015 | 13,515,271 | 9,272,740 | 4,157,706 | 58,334 | 26,491 |
| 2020 | 14,047,594 | 9,733,276 | 4,234,381 | 55,476 | 24,461 |
| 2025 | 14,236,627 | 9,944,109 | 4,217,326 | 53,145 | 22,047 |
* Compiled and edited by the Japan in Data editorial team based on official government statistics.
Tokyo’s share of Japan’s total population was 6.61% in 1920 and 11.58% in 2025. The metropolitan government’s monthly estimate puts the population at 14,288,867 as of October 1, 2026. These estimates start from the latest census and are updated every month, so they differ slightly from the census count shown in the table above. Japan’s national population over the 150 years since the Meiji era is a separate topic.
Wards and Cities Took Different Paths: 30 Years of Decline vs. 15-Fold Growth
The census populations of the ward area and the city area are drawn as two lines on the same scale. The red line is the wards and the black line is the cities.
* Compiled and edited by the Japan in Data editorial team based on official government statistics.
Split into wards and cities, the two series move very differently. The ward area fell from 8,893,094 in 1965 to 7,967,614 in 1995, a drop of 925,480 (10.41%) over 30 years. It then began to grow, passed its 1965 level in 2010 at 8,945,695, and reached a census high of 9,944,109 in 2025.
The city area grew at every census, from 282,584 in 1920 to 4,234,381 in 2020. Even during the 30 years from 1965 to 1995, when the wards shrank, the cities rose from 1,898,529 to 3,712,682, about 1.96 times. Comparing 1920 with 2025, the wards grew about 2.96 times and the cities about 14.9 times.
In 2025 the city area stood at 4,217,326, which is 17,055 (0.40%) below 2020. The metropolitan government’s preliminary release in May 2026 stated that the city area had declined for the first time, and the final figures released in September also place it below 2020. It is the first decline from a previous census since 1920.
In the Population Survey of November 1, 1945, the ward area counted 2,777,010 people, 59.03% fewer than the 6,778,804 counted in 1940. The city area, by contrast, counted 641,890, more than its 1940 figure of 505,079. In that year too, the ward and city series moved in opposite directions.
How Many Tokyo Residents Live in the 23 Wards? 93% to 67%, Then 70%
This line traces the share of Tokyo residents living in the 23 wards at each census. It is the ward population divided by Tokyo’s total population.
* Compiled and edited by the Japan in Data editorial team based on official government statistics.
The share of Tokyo residents living in the ward area was 90.78% in 1920. It reached 92.56% in 1935, the highest of any census. In the 1950s it stood in the 85% to 86% range, then fell at every census from 86.71% in 1955 onward. The lowest reading was 67.43% in 2000.
From 2005 the share edged up again. In 2025 it stood at 69.85%, so about 7 in every 10 Tokyo residents lived in the 23 wards. Over the same span, the city area’s share of Tokyo’s population rose from 7.64% in 1920 to 29.62% in 2025.
The district area’s population peaked at 61,232 in 1995, and the island area’s at 41,130 in 1950. In 2025 the two areas counted 53,145 and 22,047 respectively, and the island area stood 46.4% below its 1950 level. Both areas follow paths of their own that differ from the wards and the cities.
Where Did Tokyo Grow, 2020 to 2025? Wards Up 210,000, Cities Down 17,000
These bars show how many people each of the four areas gained or lost between the 2020 and 2025 censuses.
* Compiled and edited by the Japan in Data editorial team based on official government statistics.
Comparing the 2020 and 2025 censuses (both final figures), Tokyo as a whole gained 189,033 people (1.35%). The ward area gained 210,833 (2.17%), more than the increase for Tokyo as a whole. The city area lost 17,055 (0.40%), the district area lost 2,331 (4.20%) and the island area lost 2,414 (9.87%).
By municipality, the largest gains in numbers were in Koto Ward (29,192), Taito Ward (16,602) and Katsushika Ward (14,174). By rate of growth, Taito Ward (7.85%), Chuo Ward (7.48%) and Koto Ward (5.57%) ranked highest. Only three of the 23 wards declined over the five years: Shibuya, Meguro and Chiyoda.
In the city area, Tachikawa gained the most, at 5,723. The largest losses were in Machida (10,694), Tama (5,376) and Hachioji (4,927), and 15 of the 26 cities declined. All four towns and villages in the district area and all nine in the island area also had fewer residents than in 2020.
Deaths Exceed Births, Yet Tokyo Grows: The 2025 Breakdown
The change during 2025 is split into the metropolitan government’s own categories: moves with other prefectures, births and deaths, and other changes.
* Compiled and edited by the Japan in Data editorial team based on official government statistics.
Separately from the census, the metropolitan government publishes the annual movement of Tokyo’s population based on the Basic Resident Register. According to its report Population Movement in 2025, Tokyo’s population rose by 75,018 (0.53%) during 2025, reaching 14,270,748 as of January 1, 2026.
Natural decrease, with deaths exceeding births, came to 51,242, while net migration from other prefectures added 61,607 and other changes added 64,653, leaving an overall increase. Counting Japanese nationals only, Tokyo recorded 85,106 births and 139,259 deaths in 2025.
According to the metropolitan government, Japanese nationals moving in from other prefectures have outnumbered those moving out for 29 consecutive years since 1997. Among Japanese nationals, deaths have exceeded births every year since 2012 except 2015. Foreign residents increased by 61,205 within the “other” category, shown here as the metropolitan government classifies it.
These figures are annual changes from the Basic Resident Register. The census measures the population with a different method and over five-year intervals, so the two sets of changes cannot be added to or subtracted from each other for comparison.
Kaede’s Summary: What 105 Years of Tokyo Population Data Show
Read in sequence, the five charts show the overall increase, the contrast between wards and cities, and the breakdown of one year’s change. Here they are organized as three observations.
The question was how Tokyo’s population has changed over the past century and where it is growing now. The charts in this article have set out 105 years of census figures and the breakdown of the change during 2025. Rather than what comes next, the movement so far is summarized below as observed facts.
Taken together, the three observations show one pattern. Tokyo’s population is growing overall, but in the 2025 census the increase was in the ward area, while the city, district and island areas declined. The share of residents living in the wards has risen from 67.43% in 2000 to 69.85% in 2025.
Frequently Asked Questions
When reading figures for Tokyo’s population, check two things: whether the number is a census count or a monthly estimate, and which area it covers.
Q1. How Many People Live in Tokyo Now?
In the Population Census, held every five years, the figure as of October 1, 2025 is 14,236,627 (final figures from the Ministry of Internal Affairs and Communications). The metropolitan government’s monthly estimate was 14,288,867 as of October 1, 2026. That estimate adds monthly changes from the Basic Resident Register to the census population, and past months are revised whenever new census results are released.
Q2. What Are the Ward, City, District and Island Areas?
The ward area is the 23 special wards, and the city area is 26 cities, including Hachioji and Machida. The district area is four towns and villages in Nishitama District: Mizuho, Hinode, Hinohara and Okutama. The island area is nine towns and villages on the Izu and Ogasawara Islands, from Oshima to Ogasawara. Figures by area follow the metropolitan government’s published values; for 2025, the editorial team summed the final municipal figures for each area.
Q3. Why Do the Preliminary and Final 2025 Census Figures Differ?
The preliminary figures were compiled by the metropolitan government from tables that each municipality prepared by enumeration district, and were released in May 2026. The final figures are the Basic Complete Tabulation on Population released by the Ministry of Internal Affairs and Communications on September 29, 2026. Tokyo’s final total, 14,236,627, is 9,592 lower than the preliminary figure. All 2025 values in this article use the final figures.
🔍 About the Fact-Check for This Article
Japan in Data fact-checks its articles. The evidence for the fact-check of this page is set out below.