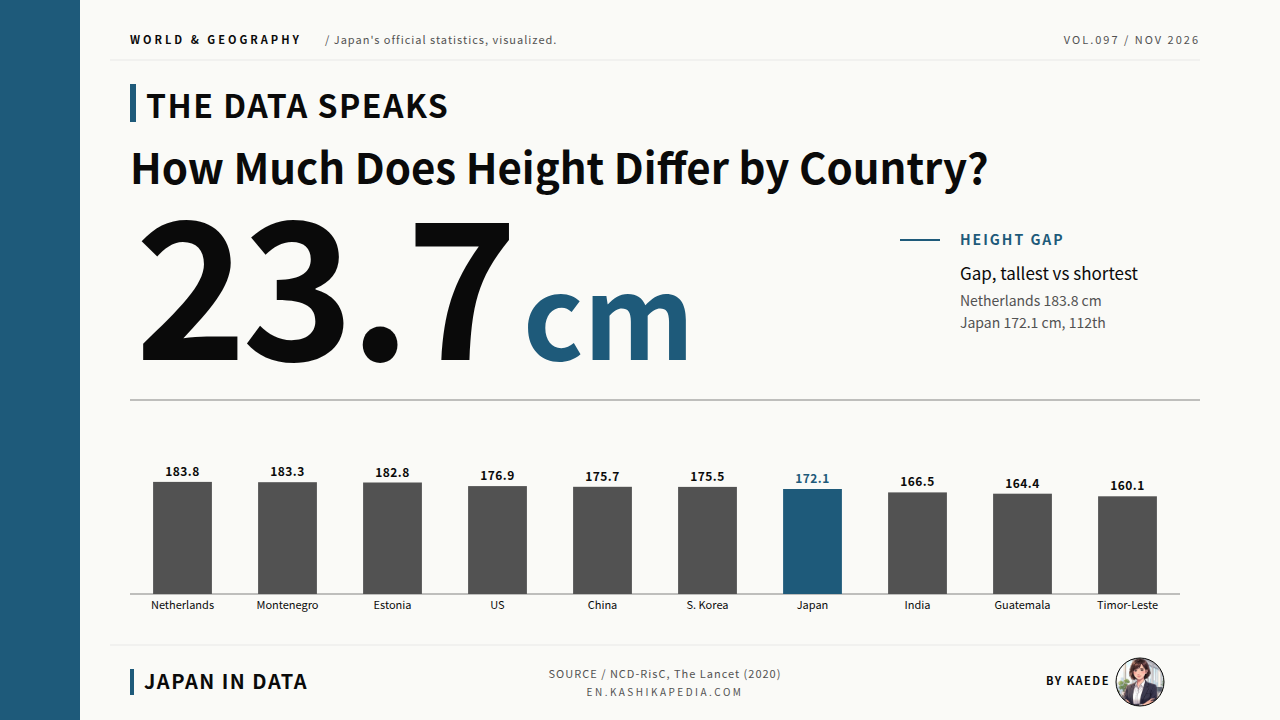

Placing height data for 200 countries on a single chart shows how widely countries differ. Among men, the tallest and shortest countries are 23.7 cm apart, and Japan sits inside the main cluster of the scatter plot.
This article compares average heights in 200 countries and territories using peer-reviewed data. According to a 2020 analysis in The Lancet by the NCD Risk Factor Collaboration (NCD-RisC), 19-year-old men are tallest in the Netherlands at 183.8 cm and shortest in Timor-Leste at 160.1 cm. The gap of 23.7 cm is about 1.9 times the 12.7 cm that Japanese 17-year-old boys gained over 125 years.
Japanese men, at 172.1 cm, rank 112th of 200, and Japanese women, at 158.5 cm, rank 145th. International differences in height are not fixed: over 100 years, South Korean women gained 20.2 cm. Researchers link changes of this size to improvements in nutrition, sanitation and health care, which have reshaped body size in many countries over the past century.
The article draws on two large peer-reviewed studies: the NCD-RisC 2020 Lancet paper (200 countries, 1985 to 2019) and the NCD-RisC 2016 eLife paper (adult height for people born from 1896 to 1996). Six charts and two tables cover a scatter plot of 200 countries, full and Asian rankings, a world map, 100-year trend lines, the gap between men and women, Japan’s long-run trend and the ranking of gains from 1985 to 2019.
The international figures come from the NCD Risk Factor Collaboration (NCD-RisC), a network of health researchers that pools measured height data and publishes modelled estimates in peer-reviewed journals. Its 2020 Lancet study covers 200 countries and territories, including non-sovereign territories, and reports heights at age 19. Japan’s long-run figures come from the School Health Statistics Survey of the Ministry of Education, Culture, Sports, Science and Technology (MEXT), which measures schoolchildren each school year. Japan’s school and fiscal year runs from April to March.
How much does average height differ between countries?
The tallest men, in the Netherlands, average 183.8 cm; the shortest, in Timor-Leste, 160.1 cm.
The gap is 23.7 cm, and Japanese men, at 172.1 cm, rank 112th of 200.
Women also No. 1 at 170.4 cm World No. 1
Lowest for women: Guatemala, 150.9 cm World lowest
Gap between the Netherlands and Timor-Leste: 23.7 cm / Japanese men: 172.1 cm (112th of 200)
* Compiled by the Japan in Data editorial team from the published data sources.
Figures are current as of the time of writing. Statistics, rules and services are subject to change, so please check the official sources for the latest information.
- Men and Women in 200 Countries: Where Japan Sits on the Scatter Plot
- Average Height by Country: Full Ranking of 200 Countries and Territories
- Average Height in Asia: Ranking of 50 Countries and Territories
- Men’s Height on a World Map: Where the Tall and Short Bands Fall
- How Heights Changed over 100 Years: Trend Lines for Major Countries
- A Gap of About 12 cm Between Men and Women, and the Countries Above It
- Japan’s Long-Run Trend: Rapid Postwar Growth, Then a Plateau from the 1980s
- Which Countries Gained the Most Height from 1985 to 2019?
- Kaede’s Summary: International Height Gaps Track Nutrition and Living Conditions
- Frequently Asked Questions
- 🔍 About the Fact-Check for This Article
Men and Women in 200 Countries: Where Japan Sits on the Scatter Plot
A scatter plot with men on the horizontal axis and women on the vertical axis is the most compact way to place 200 countries on one plane. Colouring each dot by region brings out the clusters for Europe, Asia, Africa and the other regions.
* Compiled and edited by the Japan in Data editorial team based on official government statistics.
Countries toward the upper right are taller for both men and women; those toward the lower left are shorter. Balkan and Baltic countries cluster at the top, including Montenegro (183.3 cm), Estonia (182.8 cm) and Bosnia and Herzegovina (182.5 cm). South Asia, Southeast Asia and Central America sit at the lower left. Japan (172.1 / 158.5 cm) falls on the shorter side of the East Asian cluster, below South Korea (175.5 / 163.2 cm) and China (175.7 / 163.5 cm).
Large differences also exist within regions. In East Asia, Japanese men are 3.5 to 3.6 cm shorter than men in South Korea and China (Taiwan, at 173.5 cm, is 2.0 to 2.1 cm below both). In the Middle East, Lebanon (179.0 cm) and Yemen (164.4 cm) sit in the same region. The differences broadly track the timing of each country’s economic development and nutrition transition. At the far lower left of the chart are Timor-Leste, lowest for men (160.1 / 152.7 cm), and Guatemala, lowest for women (164.4 / 150.9 cm).
Average Height by Country: Full Ranking of 200 Countries and Territories
This table lists the average heights of men and women in 200 countries and territories, sorted from the tallest men to the shortest. Japan’s row is shaded.
Average Height in 200 Countries and Territories, Men and Women (Age 19, 2019)
Heights in cm. Estimates for age 19 in 2019, sorted by men’s height. Ranks use values rounded to 0.1 cm, and equal values share a rank (women’s ranks are counted the same way). Regions follow the UN Statistics Division M49 classification, with Taiwan included in Eastern Asia. Western Asia includes Turkey, Georgia and Cyprus, among others. The shaded row is Japan. The table scrolls within its frame.
| Men’s rank | Country/territory | Region | Men | Women | Women’s rank |
|---|---|---|---|---|---|
| 1 | Netherlands | Western Europe | 183.8 | 170.4 | 1 |
| 2 | Montenegro | Southern Europe | 183.3 | 170.0 | 2 |
| 3 | Estonia | Northern Europe | 182.8 | 168.7 | 6 |
| 4 | Bosnia and Herzegovina | Southern Europe | 182.5 | 167.5 | 11 |
| 5 | Iceland | Northern Europe | 182.1 | 168.9 | 4 |
| 6 | Denmark | Northern Europe | 181.9 | 169.5 | 3 |
| 7 | Czechia | Eastern Europe | 181.2 | 168.0 | 8 |
| 7 | Latvia | Northern Europe | 181.2 | 168.8 | 5 |
| 9 | Slovakia | Eastern Europe | 181.0 | 167.1 | 14 |
| 9 | Slovenia | Southern Europe | 181.0 | 167.2 | 13 |
| 9 | Ukraine | Eastern Europe | 181.0 | 166.6 | 21 |
| 12 | Croatia | Southern Europe | 180.8 | 166.8 | 19 |
| 13 | Serbia | Southern Europe | 180.7 | 168.3 | 7 |
| 13 | Lithuania | Northern Europe | 180.7 | 167.6 | 9 |
| 13 | Poland | Eastern Europe | 180.7 | 165.8 | 30 |
| 16 | Finland | Northern Europe | 180.6 | 166.5 | 22 |
| 17 | Norway | Northern Europe | 180.5 | 166.4 | 24 |
| 17 | Sweden | Northern Europe | 180.5 | 166.7 | 20 |
| 19 | Germany | Western Europe | 180.3 | 166.2 | 25 |
| 20 | Dominica | Latin America & Caribbean | 180.2 | 166.9 | 16 |
| 21 | Bermuda | Northern America | 179.7 | 166.1 | 26 |
| 22 | Puerto Rico | Latin America & Caribbean | 179.5 | 163.1 | 61 |
| 23 | Greece | Southern Europe | 179.3 | 165.8 | 30 |
| 24 | Belgium | Western Europe | 179.1 | 163.4 | 56 |
| 25 | Ireland | Northern Europe | 179.0 | 164.5 | 43 |
| 25 | Lebanon | Western Asia | 179.0 | 163.7 | 52 |
| 27 | Andorra | Southern Europe | 178.8 | 165.5 | 34 |
| 27 | Antigua and Barbuda | Latin America & Caribbean | 178.8 | 165.7 | 32 |
| 27 | Australia | Oceania | 178.8 | 164.7 | 38 |
| 30 | Canada | Northern America | 178.7 | 164.7 | 38 |
| 30 | Switzerland | Western Europe | 178.7 | 164.3 | 46 |
| 30 | Grenada | Latin America & Caribbean | 178.7 | 166.0 | 29 |
| 30 | Belarus | Eastern Europe | 178.7 | 166.9 | 16 |
| 34 | France | Western Europe | 178.6 | 164.5 | 43 |
| 35 | Austria | Western Europe | 178.5 | 166.9 | 16 |
| 35 | Luxembourg | Western Europe | 178.5 | 165.1 | 37 |
| 37 | Cook Islands | Oceania | 178.3 | 167.3 | 12 |
| 37 | French Polynesia | Oceania | 178.3 | 166.5 | 22 |
| 39 | United Kingdom | Northern Europe | 178.2 | 163.9 | 49 |
| 40 | Romania | Eastern Europe | 177.8 | 164.7 | 38 |
| 41 | New Zealand | Oceania | 177.7 | 164.7 | 38 |
| 42 | Saint Vincent and the Grenadines | Latin America & Caribbean | 177.5 | 165.3 | 36 |
| 43 | Niue | Oceania | 177.2 | 167.0 | 15 |
| 44 | American Samoa | Oceania | 177.1 | 167.6 | 9 |
| 45 | Barbados | Latin America & Caribbean | 177.0 | 165.7 | 32 |
| 45 | Jamaica | Latin America & Caribbean | 177.0 | 164.3 | 46 |
| 47 | United States | Northern America | 176.9 | 163.3 | 58 |
| 47 | Tunisia | Northern Africa | 176.9 | 161.7 | 81 |
| 49 | Russia | Eastern Europe | 176.6 | 164.5 | 43 |
| 49 | Hungary | Eastern Europe | 176.6 | 162.5 | 68 |
| 51 | Saint Lucia | Latin America & Caribbean | 176.4 | 165.5 | 34 |
| 51 | North Macedonia | Southern Europe | 176.4 | 160.9 | 97 |
| 51 | Libya | Northern Africa | 176.4 | 162.6 | 67 |
| 51 | Turkey | Western Asia | 176.4 | 161.8 | 79 |
| 51 | Morocco | Northern Africa | 176.4 | 161.2 | 90 |
| 56 | Cabo Verde | Sub-Saharan Africa | 176.3 | 163.1 | 61 |
| 57 | Senegal | Sub-Saharan Africa | 176.2 | 163.9 | 49 |
| 58 | Spain | Southern Europe | 176.1 | 162.0 | 77 |
| 58 | Tokelau | Oceania | 176.1 | 166.1 | 26 |
| 60 | Trinidad and Tobago | Latin America & Caribbean | 176.0 | 163.4 | 56 |
| 60 | Israel | Western Asia | 176.0 | 162.2 | 73 |
| 60 | Georgia | Western Asia | 176.0 | 163.2 | 59 |
| 63 | Seychelles | Sub-Saharan Africa | 175.9 | 162.5 | 68 |
| 64 | Brazil | Latin America & Caribbean | 175.7 | 162.4 | 70 |
| 64 | China | Eastern Asia | 175.7 | 163.5 | 54 |
| 66 | Iran | Southern Asia | 175.6 | 161.2 | 90 |
| 66 | Moldova | Eastern Europe | 175.6 | 163.0 | 63 |
| 68 | South Korea | Eastern Asia | 175.5 | 163.2 | 59 |
| 68 | Kazakhstan | Central Asia | 175.5 | 161.7 | 81 |
| 70 | Tonga | Oceania | 175.1 | 166.1 | 26 |
| 71 | Palestine | Western Asia | 175.0 | 161.3 | 87 |
| 71 | Algeria | Northern Africa | 175.0 | 162.3 | 71 |
| 71 | Mali | Sub-Saharan Africa | 175.0 | 162.0 | 77 |
| 71 | Kuwait | Western Asia | 175.0 | 160.1 | 112 |
| 75 | Jordan | Western Asia | 174.8 | 159.5 | 128 |
| 75 | Hong Kong | Eastern Asia | 174.8 | 160.6 | 101 |
| 75 | Argentina | Latin America & Caribbean | 174.8 | 161.2 | 90 |
| 78 | North Korea | Eastern Asia | 174.7 | 161.2 | 90 |
| 79 | Dominican Republic | Latin America & Caribbean | 174.6 | 161.2 | 90 |
| 79 | Egypt | Northern Africa | 174.6 | 160.9 | 97 |
| 81 | Suriname | Latin America & Caribbean | 174.5 | 162.3 | 71 |
| 82 | Italy | Southern Europe | 174.4 | 161.8 | 79 |
| 82 | Samoa | Oceania | 174.4 | 163.8 | 51 |
| 82 | Bahamas | Latin America & Caribbean | 174.4 | 163.5 | 54 |
| 82 | Malta | Southern Europe | 174.4 | 163.0 | 63 |
| 82 | Turkmenistan | Central Asia | 174.4 | 162.8 | 65 |
| 82 | Portugal | Southern Europe | 174.4 | 161.2 | 90 |
| 88 | Uruguay | Latin America & Caribbean | 174.3 | 161.6 | 84 |
| 89 | Bulgaria | Eastern Europe | 174.2 | 164.6 | 42 |
| 90 | United Arab Emirates | Western Asia | 174.1 | 160.5 | 104 |
| 90 | Albania | Southern Europe | 174.1 | 162.2 | 73 |
| 92 | Costa Rica | Latin America & Caribbean | 174.0 | 160.4 | 106 |
| 92 | Azerbaijan | Western Asia | 174.0 | 161.4 | 85 |
| 92 | Fiji | Oceania | 174.0 | 164.3 | 46 |
| 95 | Greenland | Northern America | 173.8 | 161.4 | 85 |
| 95 | Paraguay | Latin America & Caribbean | 173.8 | 159.8 | 120 |
| 95 | Iraq | Western Asia | 173.8 | 158.7 | 141 |
| 98 | Saint Kitts and Nevis | Latin America & Caribbean | 173.7 | 162.8 | 65 |
| 98 | Armenia | Western Asia | 173.7 | 159.9 | 117 |
| 100 | Cuba | Latin America & Caribbean | 173.6 | 160.1 | 112 |
| 101 | Venezuela | Latin America & Caribbean | 173.5 | 160.0 | 115 |
| 101 | Taiwan | Eastern Asia | 173.5 | 160.7 | 99 |
| 101 | Singapore | South-eastern Asia | 173.5 | 161.3 | 87 |
| 104 | Qatar | Western Asia | 173.3 | 160.7 | 99 |
| 105 | Botswana | Sub-Saharan Africa | 173.2 | 162.1 | 75 |
| 106 | Mauritius | Sub-Saharan Africa | 173.0 | 158.9 | 135 |
| 107 | Chile | Latin America & Caribbean | 172.9 | 159.4 | 130 |
| 108 | Bahrain | Western Asia | 172.8 | 158.3 | 150 |
| 109 | Cyprus | Western Asia | 172.7 | 160.6 | 101 |
| 110 | Haiti | Latin America & Caribbean | 172.2 | 160.6 | 101 |
| 110 | Guyana | Latin America & Caribbean | 172.2 | 159.6 | 127 |
| 112 | Cameroon | Sub-Saharan Africa | 172.1 | 160.4 | 106 |
| 112 | Sudan | Northern Africa | 172.1 | 160.4 | 106 |
| 112 | Japan | Eastern Asia | 172.1 | 158.5 | 145 |
| 115 | Burkina Faso | Sub-Saharan Africa | 171.9 | 161.3 | 87 |
| 115 | Colombia | Latin America & Caribbean | 171.9 | 158.0 | 156 |
| 117 | Chad | Sub-Saharan Africa | 171.8 | 162.1 | 75 |
| 118 | Oman | Western Asia | 171.7 | 158.4 | 147 |
| 118 | Kyrgyzstan | Central Asia | 171.7 | 160.2 | 111 |
| 120 | Syria | Western Asia | 171.6 | 159.4 | 130 |
| 120 | Thailand | South-eastern Asia | 171.6 | 159.4 | 130 |
| 120 | Nigeria | Sub-Saharan Africa | 171.6 | 158.1 | 152 |
| 123 | Tuvalu | Oceania | 171.3 | 163.6 | 53 |
| 124 | Republic of the Congo | Sub-Saharan Africa | 171.2 | 158.8 | 138 |
| 124 | Somalia | Sub-Saharan Africa | 171.2 | 159.9 | 117 |
| 126 | Uzbekistan | Central Asia | 170.9 | 160.3 | 109 |
| 127 | Djibouti | Sub-Saharan Africa | 170.8 | 159.8 | 120 |
| 128 | Guinea | Sub-Saharan Africa | 170.7 | 158.8 | 138 |
| 128 | Zimbabwe | Sub-Saharan Africa | 170.7 | 159.8 | 120 |
| 128 | Mongolia | Eastern Asia | 170.7 | 159.9 | 117 |
| 128 | El Salvador | Latin America & Caribbean | 170.7 | 156.4 | 172 |
| 128 | Saudi Arabia | Western Asia | 170.7 | 158.8 | 138 |
| 133 | Palau | Oceania | 170.6 | 159.5 | 128 |
| 133 | Eritrea | Sub-Saharan Africa | 170.6 | 157.6 | 160 |
| 135 | Belize | Latin America & Caribbean | 170.5 | 158.1 | 152 |
| 135 | Gabon | Sub-Saharan Africa | 170.5 | 160.0 | 115 |
| 135 | Kenya | Sub-Saharan Africa | 170.5 | 159.4 | 130 |
| 138 | Sao Tome and Principe | Sub-Saharan Africa | 170.4 | 159.8 | 120 |
| 139 | Ghana | Sub-Saharan Africa | 170.3 | 158.9 | 135 |
| 139 | Mexico | Latin America & Caribbean | 170.3 | 157.9 | 158 |
| 139 | Niger | Sub-Saharan Africa | 170.3 | 159.8 | 120 |
| 142 | Panama | Latin America & Caribbean | 170.2 | 158.2 | 151 |
| 143 | Togo | Sub-Saharan Africa | 170.1 | 159.1 | 134 |
| 143 | Kiribati | Oceania | 170.1 | 161.0 | 96 |
| 145 | Nicaragua | Latin America & Caribbean | 169.9 | 155.6 | 177 |
| 146 | Namibia | Sub-Saharan Africa | 169.7 | 160.3 | 109 |
| 147 | South Africa | Sub-Saharan Africa | 169.6 | 158.6 | 144 |
| 147 | Honduras | Latin America & Caribbean | 169.6 | 155.2 | 180 |
| 147 | Micronesia (Federated States of) | Oceania | 169.6 | 159.7 | 125 |
| 147 | Nauru | Oceania | 169.6 | 157.8 | 159 |
| 151 | Eswatini | Sub-Saharan Africa | 169.4 | 158.9 | 135 |
| 152 | Malaysia | South-eastern Asia | 169.2 | 157.1 | 164 |
| 153 | Central African Republic | Sub-Saharan Africa | 169.0 | 159.7 | 125 |
| 154 | Vietnam | South-eastern Asia | 168.9 | 158.4 | 147 |
| 155 | Ethiopia | Sub-Saharan Africa | 168.8 | 157.2 | 163 |
| 156 | Uganda | Sub-Saharan Africa | 168.7 | 158.5 | 145 |
| 157 | Democratic Republic of the Congo | Sub-Saharan Africa | 168.6 | 156.3 | 173 |
| 158 | Afghanistan | Southern Asia | 168.5 | 156.1 | 174 |
| 158 | Angola | Sub-Saharan Africa | 168.5 | 158.1 | 152 |
| 160 | Benin | Sub-Saharan Africa | 168.4 | 158.4 | 147 |
| 160 | Tajikistan | Central Asia | 168.4 | 158.1 | 152 |
| 160 | Gambia | Sub-Saharan Africa | 168.4 | 161.7 | 81 |
| 163 | Vanuatu | Oceania | 168.3 | 160.5 | 104 |
| 164 | Côte d’Ivoire | Sub-Saharan Africa | 168.2 | 158.7 | 141 |
| 164 | Equatorial Guinea | Sub-Saharan Africa | 168.2 | 158.0 | 156 |
| 164 | Guinea-Bissau | Sub-Saharan Africa | 168.2 | 158.7 | 141 |
| 167 | Bolivia | Latin America & Caribbean | 168.1 | 155.6 | 177 |
| 167 | Sri Lanka | Southern Asia | 168.1 | 155.9 | 176 |
| 169 | Lesotho | Sub-Saharan Africa | 167.9 | 156.7 | 168 |
| 169 | Maldives | Southern Asia | 167.9 | 154.3 | 193 |
| 171 | Comoros | Sub-Saharan Africa | 167.7 | 156.5 | 170 |
| 172 | Zambia | Sub-Saharan Africa | 167.6 | 157.3 | 161 |
| 173 | Burundi | Sub-Saharan Africa | 167.3 | 155.1 | 184 |
| 173 | Pakistan | Southern Asia | 167.3 | 154.8 | 186 |
| 173 | Ecuador | Latin America & Caribbean | 167.3 | 155.2 | 180 |
| 176 | Bhutan | Southern Asia | 167.0 | 155.2 | 180 |
| 176 | Tanzania | Sub-Saharan Africa | 167.0 | 156.9 | 165 |
| 178 | Peru | Latin America & Caribbean | 166.8 | 154.4 | 191 |
| 179 | Myanmar | South-eastern Asia | 166.7 | 154.7 | 189 |
| 180 | India | Southern Asia | 166.5 | 155.2 | 180 |
| 181 | Sierra Leone | Sub-Saharan Africa | 166.4 | 157.3 | 161 |
| 182 | Brunei | South-eastern Asia | 166.3 | 154.9 | 185 |
| 182 | Indonesia | South-eastern Asia | 166.3 | 154.4 | 191 |
| 184 | Rwanda | Sub-Saharan Africa | 166.0 | 156.7 | 168 |
| 185 | Malawi | Sub-Saharan Africa | 165.7 | 156.1 | 174 |
| 186 | Mauritania | Sub-Saharan Africa | 165.5 | 160.1 | 112 |
| 186 | Liberia | Sub-Saharan Africa | 165.5 | 156.5 | 170 |
| 188 | Cambodia | South-eastern Asia | 165.3 | 154.7 | 189 |
| 188 | Marshall Islands | Oceania | 165.3 | 154.8 | 186 |
| 190 | Philippines | South-eastern Asia | 165.2 | 154.1 | 194 |
| 190 | Madagascar | Sub-Saharan Africa | 165.2 | 153.1 | 195 |
| 192 | Bangladesh | Southern Asia | 165.1 | 152.4 | 198 |
| 193 | Yemen | Western Asia | 164.4 | 154.8 | 186 |
| 193 | Nepal | Southern Asia | 164.4 | 152.4 | 198 |
| 193 | Guatemala | Latin America & Caribbean | 164.4 | 150.9 | 200 |
| 196 | Mozambique | Sub-Saharan Africa | 164.3 | 155.4 | 179 |
| 197 | Papua New Guinea | Oceania | 163.1 | 156.9 | 165 |
| 197 | Solomon Islands | Oceania | 163.1 | 156.8 | 167 |
| 199 | Laos | South-eastern Asia | 162.8 | 153.1 | 195 |
| 200 | Timor-Leste | South-eastern Asia | 160.1 | 152.7 | 197 |
* Compiled and edited by the Japan in Data editorial team based on official government statistics.
The Netherlands ranks first for men at 183.8 cm, followed by Montenegro (183.3 cm) and Estonia (182.8 cm). Japanese men rank 112th at 172.1 cm, and Japanese women rank 145th at 158.5 cm. Japan ranks lower in the world for women than it does for men.
NCD-RisC’s world estimates for 19-year-olds in 2019 are 170.8 cm for men and 158.6 cm for women. Japanese men are 1.2 cm above the world figure, and Japanese women are almost exactly at it. The lowest figures are in Timor-Leste for men (160.1 cm) and Guatemala for women (150.9 cm); Guatemalan men rank 193rd at 164.4 cm.
Average Height in Asia: Ranking of 50 Countries and Territories
Only the 50 countries and territories in the UN’s Asia region are shown here, sorted by men’s height. The list includes countries in Western and Central Asia.
Average Height in Asia, 50 Countries and Territories (Age 19, 2019)
Heights in cm. The 50 countries and territories in the UN M49 Asia region, sorted by men’s height (ranks use values rounded to 0.1 cm, and equal values share a rank). Western and Central Asia are included, and Taiwan is included in Eastern Asia. The shaded row is Japan.
| Rank | Country/territory | Men | Women |
|---|---|---|---|
| 1 | Lebanon | 179.0 | 163.7 |
| 2 | Turkey | 176.4 | 161.8 |
| 3 | Israel | 176.0 | 162.2 |
| 3 | Georgia | 176.0 | 163.2 |
| 5 | China | 175.7 | 163.5 |
| 6 | Iran | 175.6 | 161.2 |
| 7 | South Korea | 175.5 | 163.2 |
| 7 | Kazakhstan | 175.5 | 161.7 |
| 9 | Palestine | 175.0 | 161.3 |
| 9 | Kuwait | 175.0 | 160.1 |
| 11 | Jordan | 174.8 | 159.5 |
| 11 | Hong Kong | 174.8 | 160.6 |
| 13 | North Korea | 174.7 | 161.2 |
| 14 | Turkmenistan | 174.4 | 162.8 |
| 15 | United Arab Emirates | 174.1 | 160.5 |
| 16 | Azerbaijan | 174.0 | 161.4 |
| 17 | Iraq | 173.8 | 158.7 |
| 18 | Armenia | 173.7 | 159.9 |
| 19 | Taiwan | 173.5 | 160.7 |
| 19 | Singapore | 173.5 | 161.3 |
| 21 | Qatar | 173.3 | 160.7 |
| 22 | Bahrain | 172.8 | 158.3 |
| 23 | Cyprus | 172.7 | 160.6 |
| 24 | Japan | 172.1 | 158.5 |
| 25 | Oman | 171.7 | 158.4 |
| 25 | Kyrgyzstan | 171.7 | 160.2 |
| 27 | Syria | 171.6 | 159.4 |
| 27 | Thailand | 171.6 | 159.4 |
| 29 | Uzbekistan | 170.9 | 160.3 |
| 30 | Mongolia | 170.7 | 159.9 |
| 30 | Saudi Arabia | 170.7 | 158.8 |
| 32 | Malaysia | 169.2 | 157.1 |
| 33 | Vietnam | 168.9 | 158.4 |
| 34 | Afghanistan | 168.5 | 156.1 |
| 35 | Tajikistan | 168.4 | 158.1 |
| 36 | Sri Lanka | 168.1 | 155.9 |
| 37 | Maldives | 167.9 | 154.3 |
| 38 | Pakistan | 167.3 | 154.8 |
| 39 | Bhutan | 167.0 | 155.2 |
| 40 | Myanmar | 166.7 | 154.7 |
| 41 | India | 166.5 | 155.2 |
| 42 | Brunei | 166.3 | 154.9 |
| 42 | Indonesia | 166.3 | 154.4 |
| 44 | Cambodia | 165.3 | 154.7 |
| 45 | Philippines | 165.2 | 154.1 |
| 46 | Bangladesh | 165.1 | 152.4 |
| 47 | Yemen | 164.4 | 154.8 |
| 47 | Nepal | 164.4 | 152.4 |
| 49 | Laos | 162.8 | 153.1 |
| 50 | Timor-Leste | 160.1 | 152.7 |
* Compiled and edited by the Japan in Data editorial team based on official government statistics.
In Asia, Lebanon has both the tallest men (179.0 cm) and the tallest women (163.7 cm). Within East Asia, China is tallest at 175.7 cm. Japanese men, at 172.1 cm, rank 24th of the 50 countries and territories in Asia. The lowest figure is in Timor-Leste, at 160.1 cm, which is 18.8 cm below Lebanon.
Men’s Height on a World Map: Where the Tall and Short Bands Fall
Colouring a map shows the geography of height at a glance. The tallest band (180 cm and above) is concentrated in northwestern Europe, and the shortest band (under 165 cm) spreads across parts of Central America, South Asia and Southeast Asia.
* Compiled and edited by the Japan in Data editorial team based on official government statistics.
The clearest pattern on the map is the tall band in northwestern Europe. The Netherlands (183.8 cm) leads, with Denmark (181.9 cm), Sweden (180.5 cm) and Germany (180.3 cm) close behind. North America is lower than Europe (United States 176.9 cm, Canada 178.7 cm). In East Asia, China and South Korea are in the 175 cm range and Japan in the 172 cm range, placing the region in the middle bands.
Eight countries and territories fall in the band below 165 cm, including Guatemala in Central America (164.4 cm), Nepal in South Asia (164.4 cm), and Laos (162.8 cm) and Timor-Leste (160.1 cm) in Southeast Asia. In South Asia, India (166.5 cm) and Bangladesh (165.1 cm) sit near the bottom of the 165 to 170 cm band.
Southeast Asia also varies widely. Timor-Leste, at 160.1 cm, and Thailand, at 171.6 cm, are 11.5 cm apart, with the Philippines in between at 165.2 cm. Neighbouring countries can differ sharply in height. Some researchers link these differences more to when economic development and the nutrition transition took place in each country than to geography itself.
How Heights Changed over 100 Years: Trend Lines for Major Countries
Overlaying lines for people born from 1896 to 1996 makes it easy to compare how much each country gained over 100 years. The steepness of the rise, and the point at which it began, differ widely by country.
* Compiled and edited by the Japan in Data editorial team based on official government statistics.
South Korea and Iran show the steepest 100-year rises. South Korean men went from 159.8 cm (born 1896) to 174.9 cm (born 1996), a gain of 15.2 cm. The NCD-RisC 2016 eLife paper reports the largest 100-year gains as 20.2 cm for South Korean women (95% credible interval 17.5 to 22.7) and 16.5 cm for Iranian men (13.3 to 19.7). Some researchers link these gains to rapid economic growth and better food supply from the 1950s to the 1980s.
Japanese men rose from 156.2 cm for those born in 1896 to 170.8 cm for those born in 1996, a gain of 14.7 cm and the fifth largest among men in 200 countries (Japanese women gained 16.0 cm, the second largest). Most of the increase came during the period of rapid postwar growth from 1945 to 1980, and later generations show little change.
Dutch men were already tall among those born in 1896, at 169.4 cm, and gained a further 13.1 cm to reach 182.5 cm among those born in 1996 (eLife 2016). The age-19 estimate for 2019 (Lancet 2020) puts Dutch men at 183.8 cm. Guatemalan men gained 9.5 cm over 100 years (153.9 cm to 163.4 cm), and their gap with South Korean men widened from 5.9 cm for those born in 1896 to 11.5 cm for those born in 1996.
A Gap of About 12 cm Between Men and Women, and the Countries Above It
Plotting men’s and women’s heights on the same plane allows the gap between them to be compared country by country. A line marking the world gap of 12.2 cm shows which countries have larger or smaller gaps.
* Compiled and edited by the Japan in Data editorial team based on official government statistics.
According to the NCD-RisC 2020 data, the world estimate puts the gap between men and women at about 12 cm (12.2 cm). Of 200 countries and territories, 116 have gaps of 11 to 13.9 cm, 34 have gaps of 14 cm or more, and 50 have gaps under 11 cm, all calculated from unrounded values. Large gaps are more common in Western Asia and parts of the Caribbean, with Puerto Rico (men 179.5 cm, women 163.1 cm, a gap of 16.4 cm), North Macedonia and Jordan near the top.
Japan’s gap, between 172.1 cm and 158.5 cm, is 13.6 cm, slightly larger than the world figure of 12.2 cm. Within East Asia, China (12.2 cm), South Korea (12.3 cm) and Japan (13.6 cm) fall in a close range of 12 to 14 cm. The gap itself varies relatively little between countries; the stronger pattern is that countries with tall men also tend to have tall women. Women’s heights, like men’s, have been observed to rise as nutrition and sanitation improve.
Japan’s Long-Run Trend: Rapid Postwar Growth, Then a Plateau from the 1980s
Japan’s School Health Statistics Survey is a long-running series that goes back to FY1900. The trend line for 17-year-olds shows two clear stages: rapid growth after the war, and a plateau from the 1980s onward.
* Compiled and edited by the Japan in Data editorial team based on official government statistics.
According to the MEXT School Health Statistics Survey, the average height of 17-year-old boys rose from 157.9 cm in FY1900 to 170.6 cm in FY2025, about 13 cm over 125 years. The rise was uneven and steepest from postwar reconstruction after 1948 into the 1980s. Boys measured 165.0 cm in FY1960 and 169.7 cm in FY1980, then reached 170.1 cm in FY1982. Heights have stayed in the 170 cm range for more than 40 years since.
Girls rose from 147.0 cm in FY1900 to 157.9 cm in FY2025, about 11 cm, and have stayed in the 157 to 158 cm range since the 1980s. Researchers have pointed to several possible factors behind the plateau, including a rising share of low-birthweight babies from the 1980s and changes in diet quality as eating habits westernized. While Japan has plateaued, South Korea and China kept growing after 1985, and by 2019 their men were well above Japanese men.
Which Countries Gained the Most Height from 1985 to 2019?
Ranking countries by how much the height of 19-year-olds changed over the 34 years from 1985 to 2019 separates the countries still growing from those that have already levelled off.
* Compiled and edited by the Japan in Data editorial team based on official government statistics.
According to the NCD-RisC 2020 Lancet country estimates, China recorded the largest gain in the height of 19-year-old men over the 34 years from 1985 to 2019: 8.0 cm, the most of any of the 200 countries and territories. Some observers link this to nationwide improvements in nutrition, including in rural areas, during the rapid economic growth that followed China’s reform and opening. Saudi Arabia (+7.7 cm), South Korea (+6.8 cm), the Maldives (+6.8 cm) and Thailand (+5.9 cm) follow.
Japan gained 1.6 cm, ranking 131st of 200 countries and territories. Most of Japan’s increase had already taken place by 1985. Countries that were already tall in 1985, such as the Netherlands (+3.2 cm), France (+2.5 cm) and the United States (+1.2 cm), also did not gain much more than the world as a whole (+2.8 cm). In 24 countries and territories, including some in sub-Saharan Africa, height fell.
In 1985, Chinese 19-year-old men were 2.8 cm shorter than Japanese men of the same age. By 2019, at 175.7 cm, they were 3.6 cm taller than Japanese men (172.1 cm). The difference in gains over 34 years has reversed the order of the two countries.
Kaede’s Summary: International Height Gaps Track Nutrition and Living Conditions
Six charts and two tables have set out height data for 200 countries. Viewed from several angles, through the scatter plots, tables, map, trend lines, the gap between men and women, Japan’s long-run trend and the ranking of gains, the data points to three observations.
Read together, the six charts are consistent with a view widely held among researchers: international differences in height reflect the historical build-up of nutrition, sanitation and access to health care in each country, rather than differences in genetic limits. Studies of genetically similar groups raised in different environments, and the large gains in South Korea, China and Iran, are cited in support of that view.
Frequently Asked Questions
Here are answers to questions that often come up about international comparisons of height.
Q1. Why Are the Dutch the Tallest People in the World?
Research has not settled on a definitive explanation, but several factors have been suggested. The first is a diet rich in dairy and protein, rooted in a dairy farming culture dating from the 16th to 19th centuries. The second is the public health infrastructure and medical system built from the late 19th century. The third, reported in some studies, is a correlation within the Netherlands between being a taller man and having more children (the genetic selection hypothesis).
Researchers regard this last factor as insufficient on its own to explain an average of 183.8 cm, and current academic understanding points to several factors interacting. Dutch men’s height has also levelled off for those born from 1980 onward (182.5 cm to 182.5 cm), and the increase has stopped among younger generations.
Q2. Why Did Japanese Heights Stop Rising in the 1980s?
No single cause has been clearly identified, but there are several hypotheses. (1) Reaching genetic potential: Japan may have come close to its genetic average. (2) A rising share of low-birthweight babies: since the 1980s, the share of babies born under 2,500 g has increased in Japan, and some researchers suggest this may affect growth over a lifetime.
(3) Dietary change: even with enough calories, intake patterns for specific nutrients needed for growth may have changed. Over the same period, heights in South Korea and China kept rising, which researchers cite as evidence against an explanation based on an East Asian genetic limit.
Q3. How Much of the Difference Between Countries Is Genetic?
At the individual level, genetics is said to explain 80 to 90% of the variation in height, but for differences between national averages, environmental factors are considered dominant. The evidence most often cited is a study of the children of Maya migrants from Guatemala: children raised in the United States grew several centimetres taller than peers who stayed in Guatemala.
The finding that height changes with the environment even when genes are the same is cited in support of the view that differences between national averages reflect differences in nutrition and environment. The 20.2 cm gain among South Korean women over 100 years is likewise described as an environmental change, achieved without any change in genes.
Q4. What Is the Average Height Worldwide?
NCD-RisC’s world estimates put the average height of 19-year-olds in 2019 at 170.8 cm for men and 158.6 cm for women. In 1985 the figures were 168.0 cm and 156.5 cm, a gain of 2.8 cm for men and 2.1 cm for women over 34 years. These are world estimates and differ from a simple average of the 200 country values.
Q5. Which Country in Asia Has the Tallest Average Height?
Among the 50 countries and territories in the UN’s Asia region, Lebanon is tallest for both men and women, at 179.0 cm for men and 163.7 cm for women (age 19, 2019). Within East Asia, China is tallest (men 175.7 cm, women 163.5 cm), and Japanese men rank 24th in Asia at 172.1 cm.
Q6. What Is the Average Height in Canada?
According to NCD-RisC estimates, 19-year-old men in Canada averaged 178.7 cm in 2019, ranking 30th of 200 countries and territories, and 19-year-old women averaged 164.7 cm, ranking 38th. In the neighbouring United States, men averaged 176.9 cm and women 163.3 cm.
🔍 About the Fact-Check for This Article
Japan in Data fact-checks its articles. The evidence for the fact-check on this page is set out below.