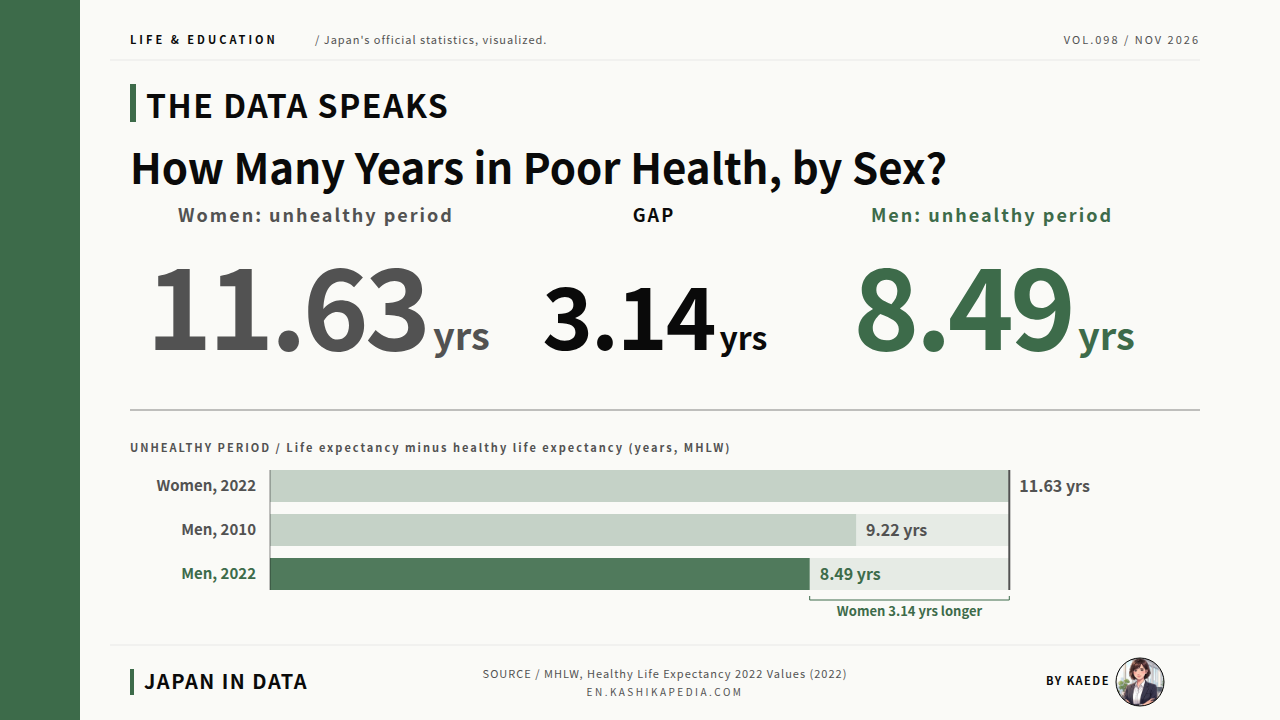

Start by placing the gap between life expectancy and healthy life expectancy side by side as two bars, one for men and one for women. The unhealthy period, the years in which care or limits on daily life are needed, takes a visibly different length for each sex.
Life expectancy in Japan is 81.05 years for men and 87.09 years for women. Healthy life expectancy, the period lived without health problems limiting daily life, is 72.57 years for men and 75.45 years for women. The difference between the two, referred to here as the unhealthy period, was 8.49 years for men and 11.63 years for women in 2022, a gap of 3.14 years.
This article draws on two primary sources from the Ministry of Health, Labour and Welfare (MHLW): Healthy Life Expectancy 2022 Values and the Abridged Life Tables for Japan 2022. The charts set out the basic structure, the trend since 2010, prefectural maps and the regional spread of the gap between the sexes, including a pattern seen only among men.
Healthy life expectancy is the average number of years a person can live without health problems limiting daily life. In Japan it is estimated by a research group funded by the Ministry of Health, Labour and Welfare (MHLW), combining the Comprehensive Survey of Living Conditions, held every three years, with life tables. The gap between life expectancy and healthy life expectancy is called the unhealthy period here. Prefectures are Japan’s 47 top-level regions. Figures refer to 2022, the latest available year.
How different is the gap between life expectancy and healthy life expectancy for men and women?
Men live 8.49 years with limits on daily life, women 11.63 years. The period is 3.14 years longer for women.
Gap between the sexes: 3.14 years (longer for women)
Figures are current as of the time of writing. Statistics, rules and services are subject to change, so please check the official sources for the latest information.
- Life Expectancy and Healthy Life Expectancy: The Basic Structure
- The Unhealthy Period Has Shortened Gradually Since 2010
- Healthy Life Expectancy for Men: A Prefecture Tile Map
- Healthy Life Expectancy for Women: A Prefecture Tile Map
- The Top Prefecture for Healthy Life Is Not Always Shortest in Unhealthy Years
- Where the Gap Between Women and Men Is Widest and Narrowest
- Kaede’s Summary: Healthy Life Expectancy and the Unhealthy Period by Sex
- Frequently Asked Questions
- 🔍 About the Fact-Check for This Article
Life Expectancy and Healthy Life Expectancy: The Basic Structure
Lay life expectancy and healthy life expectancy along a single bar, and the last years of life remain as the unhealthy period. For both men and women, the final stretch of the lifespan always includes a period in which daily life is limited in some way.
* Compiled and edited by the Japan in Data editorial team based on official government statistics.
Healthy life expectancy is defined as the period a person can live without health problems limiting daily life, equal to life expectancy minus the period with such limits. In 2022, men had a life expectancy of 81.05 years and a healthy life expectancy of 72.57 years; women had 87.09 and 75.45 years. The unhealthy period is 8.49 years for men and 11.63 years for women. For both sexes, the last 8 to 12 years of life remain a period with some form of limitation on daily life.
Healthy life expectancy is calculated by a research group funded by the MHLW. It combines answers from the health questionnaire of the Comprehensive Survey of Living Conditions, held every three years, with mortality data from the life tables. Because of the three-year cycle, the latest value is for 2022, released at the Health Japan 21 (third term) promotion committee. The next update, based on the 2025 survey, is expected in 2027 or later.
Looking at the gap between the sexes, women’s life expectancy exceeds men’s by about 6.04 years (87.09 minus 81.05), while their healthy life expectancy exceeds men’s by only about 2.88 years (75.45 minus 72.57). Women live considerably longer, but the gap in healthy years is less than half as large. The remaining 3.14 years appears as the difference in the unhealthy period.
The Unhealthy Period Has Shortened Gradually Since 2010
Next, the unhealthy period is drawn as two lines across five survey points. From 2010 to 2022, both the line for men and the line for women slope gently downward, and the space between the two lines narrows slightly over the same twelve years.
* Compiled and edited by the Japan in Data editorial team based on official government statistics.
Since records began in 2010, the unhealthy period has shortened for both sexes. For men it fell from 9.22 years in 2010 to 8.49 years in 2022, a change of -0.73 years; for women it fell from 12.77 to 11.63 years, a change of -1.14 years. Because the female figure fell further, the gap between the sexes narrowed from about 3.55 years in 2010 to 3.14 years in 2022.
Health Japan 21 (second term, 2013 to 2022), the national health promotion plan, set the goals of extending healthy life expectancy and reducing health disparities. Health Japan 21 (third term), the current plan, states the goal of increasing healthy life expectancy by more than the increase in life expectancy. With 2022 as the baseline, an interim review is scheduled for 2028 and a final review for 2031. That goal corresponds to a shorter unhealthy period.
Over the three years from 2019 to 2022 alone, men’s healthy life expectancy fell slightly from 72.68 to 72.57 years (-0.11 years), while women’s rose slightly from 75.38 to 75.45 years (+0.07 years). Neither change is statistically significant against the previous value, and the period includes the COVID-19 pandemic. The 12-year trend is easier to read than movements within a single three-year span.
Healthy Life Expectancy for Men: A Prefecture Tile Map
Next, healthy life expectancy for men is shown on a tile map of the 47 prefectures. Darker tiles mark prefectures where healthy life expectancy is longer. Between the longest and the shortest prefecture, the difference for men in 2022 comes to 2.82 years.
* Compiled and edited by the Japan in Data editorial team based on official government statistics.
By prefecture, healthy life expectancy for men is longest in Shizuoka at 73.75 years, followed by the prefectures of Ishikawa (73.60), Yamanashi (73.47), Gunma (73.37) and Kanagawa (73.28). The shortest is Iwate at 70.93 years, with Kochi (71.19), Okinawa (71.62), Osaka (71.77) and Ehime (71.82) forming the bottom five. The gap between Shizuoka, the longest, and Iwate, the shortest, is 2.82 years.
Darker tiles cluster in the Chubu region (Shizuoka, Ishikawa, Yamanashi, Nagano, Gifu) and among the Kanto prefectures of Gunma, Kanagawa, Tochigi and Saitama, while Iwate in Tohoku, Kochi in Shikoku and Okinawa sit near the bottom. Okinawa was once known for high life expectancy, but it ranks low on healthy life expectancy. Some observers link this to changes in lifestyle.
Prefectural healthy life expectancy does not always track life expectancy or rates of lifestyle-related disease. Because it includes a self-assessed measure of whether daily life is limited, differences in healthcare provision, care infrastructure and local communities are said to be reflected in it. Among prefectures with similar life expectancy, the number of healthy years can differ.
Healthy Life Expectancy for Women: A Prefecture Tile Map
Next comes healthy life expectancy for women on the same 47-prefecture map. The geographic pattern is not identical to the one for men, and in several places the prefectures near the top or the bottom of the ranking differ between the two sexes.
* Compiled and edited by the Japan in Data editorial team based on official government statistics.
For women, healthy life expectancy is longest in Shizuoka at 76.68 years, followed by the prefectures of Yamaguchi (76.43), Gifu (76.20), Yamanashi (76.16) and Miyazaki (76.13). The shortest is Iwate at 74.28 years, with Okinawa (74.33), Kanagawa (74.71), Nara (74.76) and Tokushima (74.83) in the bottom five. The gap between Shizuoka and Iwate is 2.40 years, slightly smaller than the 2.82 years for men.
Shizuoka ranks first and Iwate last for both sexes, but the rest of the rankings differ. Ishikawa, Gunma and Kanagawa are in the male top five, while Yamaguchi, Gifu and Miyazaki are in the female top five. Geographically, Yamaguchi in the Chugoku region and Miyazaki in Kyushu rise to the top for women.
Kanagawa ranks 5th for men (73.28 years) but 45th for women (74.71 years), within the bottom five. Some prefectures rank very differently for each sex, so the regional pattern of healthy life expectancy becomes visible only when men and women are viewed separately. The 47-prefecture data show different health patterns for men and women running side by side within the same prefecture.
The Top Prefecture for Healthy Life Is Not Always Shortest in Unhealthy Years
The point to observe here is how differently the structure looks for men and for women. The prefectures with the longest healthy life expectancy are set beside those with the shortest unhealthy period, and the overlap between the two lists is checked for each sex.
* Compiled and edited by the Japan in Data editorial team based on official government statistics.
A long healthy life expectancy and a short unhealthy period sound alike but are separate indicators. Healthy life expectancy is the length of healthy years; the unhealthy period is life expectancy minus healthy life expectancy, the length of years with limits. Long-lived prefectures tend to have longer healthy life expectancy, while the unhealthy period is short where healthy years form a high share of the lifespan, even when life expectancy is short. For men, the two top-five lists share only one prefecture, Gunma.
The male top five for healthy life expectancy are Shizuoka, Ishikawa, Yamanashi, Gunma and Kanagawa. The top five for the shortest unhealthy period are Aomori, Gunma, Tochigi, Akita and Kagoshima, drawn from Tohoku, northern Kanto and southern Kyushu. Only Gunma appears in both. Shizuoka, first for healthy life expectancy at 73.75 years, and Aomori, shortest for the unhealthy period at 7.14 years, are different prefectures.
For women, the healthy life expectancy top five (Shizuoka, Yamaguchi, Gifu, Yamanashi, Miyazaki) and the shortest unhealthy period top five (Shizuoka, Yamanashi, Yamaguchi, Miyazaki, Tochigi) share four prefectures: Shizuoka, Yamanashi, Yamaguchi and Miyazaki. Long healthy lives and short periods of limitation are concentrated in the same places. The relationship between the two indicators is not the same for men and women.
Where the Gap Between Women and Men Is Widest and Narrowest
Finally, the gap in the unhealthy period between women and men is shown for each of the 47 prefectures as horizontal bars. The chart shows how far each prefecture sits above or below the national figure of 3.14 years.
* Compiled and edited by the Japan in Data editorial team based on official government statistics.
The gap in the unhealthy period (women minus men) is 3.14 years nationally, with prefectures ranging from 1.57 to 4.68 years. The largest is Kanagawa at 4.68 years, followed by Miyagi at 4.01, Tottori at 3.97, Tokushima at 3.45 and Nara at 3.68. The smallest is Yamaguchi at 1.57 years, followed by Mie at 2.11 and Ehime and Kyoto at 2.33, a spread of 3.11 years between the largest and the smallest.
In Kanagawa, women’s unhealthy period is 12.99 years, the longest in Japan, while men’s is 8.31 years, shorter than the national 8.49 years. The result is the widest gap, 4.68 years. In Yamaguchi, the unhealthy period is 8.97 years for men and 10.54 years for women: men are above the national figure and women below it, so the two periods sit close together.
The regional spread of the gap reflects the combination of women’s and men’s unhealthy periods in each prefecture. Where the gap is large, the period of limitation is considerably longer for women than for men; where it is small, both sexes spend a similar length of time with limits on daily life. The national goal of extending healthy life expectancy meets a different pattern by sex in each region.
Kaede’s Summary: Healthy Life Expectancy and the Unhealthy Period by Sex
With the trend and the regional differences laid out side by side, the structure of healthy life expectancy and the unhealthy period can be organized along four axes: national, over time, by region and by sex. The points below summarize them as three observations.
The question was how far the gap between life expectancy and healthy life expectancy differs between men and women. The charts in this article show that the unhealthy period is 3.14 years longer for women, that it has narrowed gradually over 12 years, and that the regional pattern across the 47 prefectures differs by sex. The box below sets out how to read the data.
Read together, the three observations show that the gap between life expectancy and healthy life expectancy contains patterns by sex and by region that the national average alone does not reveal. The national gap of 3.14 years sits within a prefectural range of 1.57 to 4.68 years, and the geography of healthy years differs between men and women.
Frequently Asked Questions
When reading charts of healthy life expectancy, check three points together: the three-year survey cycle, the different patterns for men and women, and the differences among the 47 prefectures. Keeping the premises of the indicator in mind widens what the data can show.
Q1. When Is Healthy Life Expectancy Updated?
Healthy life expectancy is calculated by an MHLW-funded research group from the health questionnaire of the Comprehensive Survey of Living Conditions, conducted every three years. The latest value is based on the 2022 survey and was released at the Health Japan 21 (third term) promotion committee. The next update, based on the large-scale 2025 survey, is expected in 2027 or later. Given the three-year cycle, trends over three to six years suit the indicator better than year-to-year changes.
Q2. What Exactly Is the Unhealthy Period Between Healthy Life Expectancy and Life Expectancy?
It is life expectancy minus the average period without limits on daily life, based on respondents who answer yes when the survey asks whether health problems affect their daily life in any way. The effects include limits on everyday movement, work, housework, study and exercise, needing someone to accompany them when going out, and hospital stays. It is broader than certification under long-term care insurance and covers everything from mild limitation to full care needs.
Q3. Why Does Shizuoka Rank First for Both Men and Women?
No single factor explains Shizuoka’s first place for both sexes. Government-funded health research describes lifestyle (exercise, diet, smoking rates), healthcare provision and community activity as related in combination. Factors cited for Shizuoka include green tea consumption among the highest in Japan, a mild climate associated with more time outdoors, and the development of its community-based integrated care system. The shortest unhealthy period, however, is in Aomori for men and Shizuoka for women, so the two indicators follow separate patterns.
🔍 About the Fact-Check for This Article
Japan in Data fact-checks its articles. The evidence for the fact-check on this page is set out below.