
The quickest way into how Japan’s causes of death have changed since the war is to lay the death rates of the main diseases over one another in a single line chart. Their peaks and troughs cross at four ranking shifts, which trace 78 postwar years of medicine and population ageing.
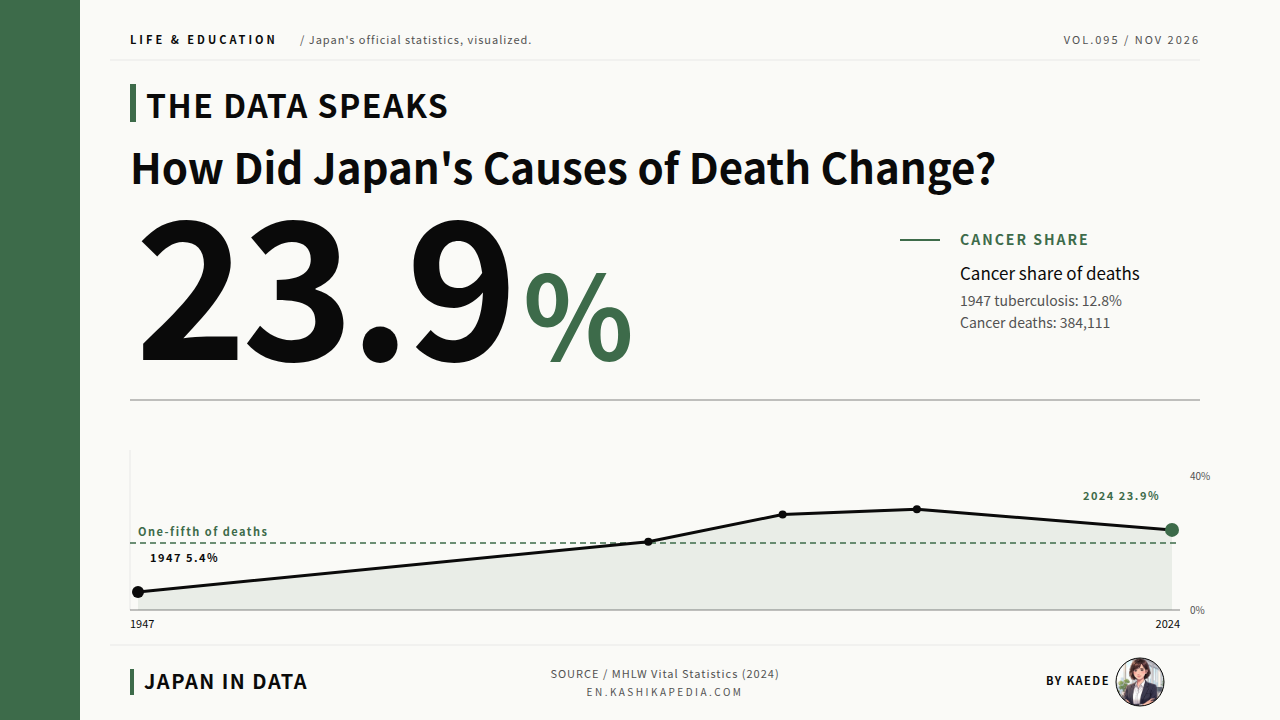
According to the Vital Statistics of the Ministry of Health, Labour and Welfare (MHLW), the leading cause of death in Japan in 2024 was malignant neoplasms (cancer), with 384,111 deaths. That was 23.9% of all deaths, or 319.3 per 100,000 population. Heart disease ranked second at 226,388 (14.1%), old age third at 206,887 (12.9%) and cerebrovascular disease fourth at 102,821 (6.4%).
Over the 78 years from 1947 to 2024, Japan’s leading causes of death went through four ranking shifts, moving from tuberculosis to cancer, which has now ranked first for 44 consecutive years. Four structural changes run through that period: tuberculosis receding, cancer rising, cerebrovascular disease declining and old age returning as a recorded cause.
This article works from primary sources: the MHLW Summary of Vital Statistics 2024 (final data), released September 16, 2025; Table 7 on trends in the leading causes of death; and National Cancer Center Japan’s Cancer Statistics 2025. The figures are set out as a long-run line chart, a 100% stacked area chart, a 47-prefecture tile map and a comparison of crude and age-adjusted death rates.
Japan’s cause-of-death figures come from the Vital Statistics compiled by the Ministry of Health, Labour and Welfare (MHLW) from death certificates. Each death is assigned one underlying cause using the World Health Organization’s International Classification of Diseases, applied in its ICD-10 version since 1995. A crude death rate is deaths per 100,000 population. An age-adjusted rate recalculates it using a fixed 1985 model population. Rōsui, translated here as old age, is an official cause category. Prefectures are Japan’s 47 top-level regions. Figures follow the calendar year.
How have Japan’s causes of death changed over 80 postwar years?
From tuberculosis to cancer. After four ranking shifts, cancer has ranked first for 44 straight years.
Figures are current as of the time of writing. Statistics are subject to change, so please check the official sources for the latest information.
- Four Ranking Shifts in 78 Years: Japan’s Leading Causes of Death
- Share of Deaths by Cause: Tuberculosis Fades, Cancer Rises, Old Age Returns
- Cancer Deaths by Prefecture: A Twofold Gap in Rates Under Age 75
- Crude Rates Up, Age-Adjusted Rates Down: An Apparent Increase in an Ageing Society
- Cancer Deaths by Site and Sex: Lung First for Men, Colorectal First for Women
- Old Age Returns, Pneumonia Shifts: The 2018 Rank Change and the 2017 ICD-10 Rule
- Kaede’s Summary: Three Observations Describe 80 Years of Causes of Death
- Frequently Asked Questions
- 🔍 About the Fact-Check for This Article
Four Ranking Shifts in 78 Years: Japan’s Leading Causes of Death
Seventy-eight years read more clearly as lines than as a table. With six causes overlaid, the four ranking shifts line up as vertical markers: the sharp fall of tuberculosis, the rise and fall of cerebrovascular disease, the steady climb of cancer and the renewed rise of old age, all in one view.
* Compiled and edited by the Japan in Data editorial team based on official government statistics.
Tuberculosis was the leading cause of death in the first postwar ranking. According to MHLW Table 7, tuberculosis caused 146,241 deaths in 1947, or 187.2 per 100,000 population, accounting for 12.8% of all deaths that year. In the years that followed, Japan expanded its medical system, enacted the Tuberculosis Prevention Act in 1951 and introduced streptomycin into clinical use, while the tuberculosis death rate fell rapidly.
In 1951, cerebrovascular disease (125.2 per 100,000) overtook tuberculosis (110.3), which dropped from first to second place: the first ranking shift of the postwar era. By 1955 tuberculosis had fallen to fifth place at 52.3 per 100,000, and from the 1960s onward its rate stayed in single digits. In 2024 it caused 1,462 deaths, or 1.2 per 100,000.
For the 30 years from 1951, cerebrovascular disease, mainly stroke, was Japan’s leading cause of death. Its death rate peaked at 175.8 per 100,000 in 1965 and again at 175.8 in 1970. Some observers link the high level of that era to heavy salt intake, untreated high blood pressure and the risk of onset in cold regions.
From the late 1970s the rate began to fall, over the same years in which blood pressure medication spread, salt intake declined and acute stroke care advanced. In 1981, cancer (142.0 per 100,000) overtook cerebrovascular disease (134.3) to rank first. That was the second shift, and cancer has stayed in first place for 44 consecutive years through 2024.
The third shift came in 1985, when heart disease (excluding hypertensive heart disease) reached 117.3 per 100,000 and passed cerebrovascular disease (112.2) to rank second. Heart disease is a broad category in Japanese statistics that includes ischemic heart disease, arrhythmia and heart failure, and its share has stayed in a narrow band since then.
Its rate dipped temporarily in 1995 after a revision to death certificate rules, which stated that heart failure or respiratory failure is not to be entered as the cause of death. The rate then rose again, and in 2024 heart disease accounted for 226,388 deaths, or 188.2 per 100,000 population.
The fourth shift came in 2018, when old age passed cerebrovascular disease to rank third. It has held third place for six consecutive years since then. In 2024, old age accounted for 206,887 deaths, or 172.0 per 100,000 population, the highest level since records began.
Share of Deaths by Cause: Tuberculosis Fades, Cancer Rises, Old Age Returns
A 100% stacked chart shows how each cause’s share has shifted over time. The tuberculosis band thins out toward the right while the cancer band widens across the middle, tracing the changes in medicine and social structure in Japan since the war.
* Compiled and edited by the Japan in Data editorial team based on official government statistics.
The share of all deaths attributed to each cause shows how far Japan’s pattern of mortality has changed over 78 years. In 1947 the shares were tuberculosis 12.8%, pneumonia and bronchitis 12.0%, cerebrovascular disease 9.4%, heart disease 7.0% and cancer 5.4%. Infectious and circulatory diseases held broadly similar shares, and no single disease stood far above the rest.
By 1955 the tuberculosis share had halved to 6.7%, while cerebrovascular disease rose to 17.5%. In 1985 cancer reached 20.4%, the first time any postwar cause of death had passed one-fifth of the total. Its share rose to 28.5% in 1995 and to a peak level of 30.1% in 2005, then eased slightly to 23.9% in 2024.
Cancer’s share has held at around 30% for some 30 years since the late 1990s, the longest period of dominance by a single cause in Japan’s postwar mortality record. Heart disease has stayed roughly within the 14% to 16% range since 1985 and remains at that level today, second behind cancer.
Old age follows a distinctive path. Its share was 10.9% in 1947 and fell steadily after the war to 0.6% in 1995. From 2001 it began rising again, reaching 6.7% in 2015. In 2018 it passed cerebrovascular disease to rank third, and in 2024 its share of 12.9% exceeded the 1947 level.
The 1995 adoption of ICD-10, which redefined the category as senility without mention of psychosis, is one factor cited for part of this movement. Some observers link the core of the more recent rise to a growing number of natural deaths among older people as lifespans in Japan lengthen.
Cancer Deaths by Prefecture: A Twofold Gap in Rates Under Age 75
Regional differences hidden by a national average come into view when the 47 prefectures are laid out as tiles. The darker shades follow higher rates in the Tohoku region and lower rates from western Japan to the Tokyo area, a pattern some researchers relate more to lifestyle than to latitude.
* Compiled and edited by the Japan in Data editorial team based on official government statistics.
Cancer death rates differ widely by prefecture. According to Cancer Statistics from National Cancer Center Japan’s Cancer Information Service, based on MHLW Vital Statistics for 2023, the cancer death rate for people under 75 (both sexes, per 100,000 population) was highest in Aomori Prefecture at 191.9 and lowest in Tokyo at 95.7.
The highest rate is about 2.0 times the lowest, a wide regional gap in cancer deaths among people in middle age within a single country. Aomori has ranked first in the country for 19 consecutive years since 2004, and the gap is observed as a persistent pattern rather than a one-year fluctuation.
On the 2023 under-75 measure, the five prefectures with the highest rates were Aomori (191.9), Akita (181.1), Hokkaido (161.4), Iwate (160.1) and Kochi (150.1). The five with the lowest were Tokyo (95.7), Shiga (96.2), Nagano (107.9), Aichi (107.0) and Kanagawa (107.9).
National Cancer Center Japan notes that stomach cancer death rates are high on the Sea of Japan side of the Tohoku region, in northern Japan, and liver cancer death rates are high in western Japan. Several lifestyle-related factors are suggested as involved in these regional gaps, including salt intake, smoking, obesity, cancer screening rates and regional differences in hepatitis C infection.
This indicator is a crude death rate limited to people under 75. Excluding deaths at 75 and over is intended to measure cancer deaths in middle age with greater precision. For all ages, the crude rate per 100,000 was 426.9 in Aomori and 243.3 in Tokyo, a gap of about 1.8 times, but that figure includes differences in the share of older residents.
For policy evaluation, the under-75 age-adjusted rate serves as a final outcome indicator in the fourth Basic Plan to Promote Cancer Control Programs, adopted in March 2023. Regional gaps in this measure are described as reflecting lifestyle, screening systems and socioeconomic factors more than differences in treatment outcomes.
Crude Rates Up, Age-Adjusted Rates Down: An Apparent Increase in an Ageing Society
With crude and age-adjusted rates on one chart, the same disease gives opposite answers: one line says it increased, the other says it decreased. Only the age structure behind the denominator differs, and the conclusion reverses. It is a textbook case of how the choice of measure shapes the reading.
* Compiled and edited by the Japan in Data editorial team based on official government statistics.
For the three leading causes (cancer, heart disease and cerebrovascular disease), the crude death rate and the under-75 age-adjusted death rate can be set side by side from 1990 to 2024. The crude rate is a simple rate per 100,000 population across all ages; the age-adjusted rate removes the effect of age structure. The two move in opposite directions.
Crude rates rose: cancer from 235.2 to 319.3 and heart disease from 134.8 to 188.2. Under-75 age-adjusted rates fell sharply: cancer from 92.4 to 69.6 and heart disease from 30.0 to 11.5. Once differences in age structure are removed, the risk of death has fallen for all three leading causes in postwar Japan.
The gap between the two measures tracks the ageing of Japanese society. The crude rate divides all deaths by the whole population, so it rises as the older share of the population grows. The age-adjusted rate recalculates death rates by age group against the 1985 model population, so changes in age structure do not affect it.
According to National Cancer Center Japan, the national under-75 age-adjusted cancer death rate fell from 92.4 in 2005 to 69.6 in 2020, a decline of 24.7% over 15 years. That trend runs in parallel with news that the number of cancer deaths in Japan keeps rising.
A news report that cancer deaths in Japan hit a record high and data showing that the risk of dying of cancer has fallen over the long term are both accurate. The first rests on the crude rate or on the number of deaths; the second rests on the age-adjusted rate.
The same deaths can therefore support opposite conclusions depending on the indicator, and the way the denominator and numerator are defined determines which one appears. The crude rate reflects the medical burden on society as a whole, while the age-adjusted rate reflects the individual risk of death.
Cancer Deaths by Site and Sex: Lung First for Men, Colorectal First for Women
Movements by cancer site that the overall total hides show different peaks when men and women are charted separately. Lung cancer now leads for men and colorectal cancer for women. Stomach cancer has been in long-term decline for both sexes.
* Compiled and edited by the Japan in Data editorial team based on official government statistics.
Broken down by site, cancer deaths follow different paths for men and women. According to the MHLW summary of the 2024 Vital Statistics monthly report annual total, Table 8, lung cancer is the most common cancer death among men at 52,330 (89.5 per 100,000 population), and it has ranked first among men since 1993.
Next for men come colorectal cancer at 28,825, stomach 24,719, pancreas 20,372 and liver 15,133. For women, colorectal cancer ranks first at 25,588 (41.4 per 100,000), a position it has held since 2003. It is followed by lung at 23,235, pancreas 20,862, breast 15,869 and stomach 13,147.
Over the long term, stomach cancer deaths have fallen steadily for both sexes since 1985: from 30,146 to 24,719 for men and from 18,756 to 13,147 for women by 2024, a decline of roughly 20% in each case. Some observers link the decline to wider Helicobacter pylori eradication treatment, earlier detection through endoscopy and lower salt intake.
Pancreatic cancer, by contrast, has kept rising for both sexes: from 5,953 deaths in 1985 to 20,372 in 2024 for men, about 3.4 times, and from 4,488 to 20,862 for women, about 4.6 times. Pancreatic cancer is difficult to detect early, and its five-year relative survival rate is in the 10% range, with the increase showing directly in death counts.
Lung cancer deaths among men climbed from 20,837 in 1985 to 45,189 in 2005 and peaked at 53,211 in 2015. They have eased slightly since then, standing at 52,330 in 2024, a broadly flat phase. Some observers relate this to the long-term fall in smoking rates in Japan.
Among women, breast cancer deaths rose from 4,922 in 1985 to 15,869 in 2024, about 3.2 times, and colorectal cancer deaths from 8,926 to 25,588, about 2.9 times. Breast cancer’s five-year relative survival rate exceeds 90% as screening and treatment have improved, while new cases and deaths have both risen. The differences between men’s and women’s patterns are seen as reflecting lifestyle, occupational exposure and hormonal factors.
Old Age Returns, Pneumonia Shifts: The 2018 Rank Change and the 2017 ICD-10 Rule
Old age and pneumonia have followed distinctive paths among Japan’s postwar causes of death. Both fell from high levels in 1947, then began moving in opposite directions from the 2000s. A rule change in 2017 left a clear step in the pneumonia figures.
* Compiled and edited by the Japan in Data editorial team based on official government statistics.
The death rate for old age is one of the series that moved most sharply in postwar Japan. In 1947 it stood at around 80 per 100,000. As medicine advanced, the practice of not recording old age as a cause of death spread, and the rate fell to 14.0 per 100,000 by 1995. The 1995 adoption of ICD-10, which clarified the category as senility without mention of psychosis, is also cited as a factor.
From 2001, however, the old-age death rate reversed and began to rise, reaching 67.7 per 100,000 in 2015, passing cerebrovascular disease for third place in 2018 and reaching 172.0 in 2024, above the 1947 level. In 2024 old age caused 206,887 deaths, and its 12.9% share is also the highest since records began.
Some observers link the rise both to more natural deaths among older people as lifespans lengthen and to changes in how doctors complete death certificates. In 2017 the Japan Geriatrics Society set out its view on recording old age as a cause of death, and recording the natural decline of the very old as old age became more widespread.
Several further factors are cited, including doubts about recording older people’s deaths under specific disease names such as pneumonia or heart failure, and consideration for families who wish for end-of-life care. Old age is a category signifying the absence of an identified medical disease, and its recent rise runs alongside changing ideas about death in a super-aged society.
Pneumonia stood at 174.8 per 100,000 in 1947, ranking second, and fell to 33.7 by 1980 while antibiotics came into wide use. From the 1990s it rose again alongside growth in the older population, reaching 94.1 in 2010, and in 2011 it passed cerebrovascular disease to rank third.
In 2017, clarified rules for selecting the underlying cause of death under ICD-10 (2013 version) were applied, and recorded pneumonia deaths fell quickly as other causes, such as aspiration pneumonia and old age, were selected more often. The rate dropped from 80.0 per 100,000 in 2017 to 76.2 in 2018, and stood at 66.6 (fifth place) in 2024. Aspiration pneumonia is counted separately, at 63,667 deaths in 2024 (52.9 per 100,000, sixth place).
Kaede’s Summary: Three Observations Describe 80 Years of Causes of Death
Laid side by side, the trends and regional differences covered here sort into three observations about 80 postwar years: infectious disease receding, a shift to chronic disease, and the return of old age as a cause of death in an ageing population.
To the question of how Japan’s causes of death have changed since the war, the charts in this article show four ranking shifts over 78 years and a move of the centre from tuberculosis to cancer. The choice of indicator, the time window and the method of age adjustment each tell a different story. Rather than ranking the data, the differences are set out below as observations.
Read together, the three observations trace a pattern that moved from infectious disease to chronic disease and then to natural death in a super-aged society. The decline of tuberculosis, the long dominance of cancer and the return of old age are three structural changes that have reshaped how people in Japan die. The answer to how causes of death have changed depends on which indicator, which period and which scale is used.
Frequently Asked Questions
Reading a cause-of-death chart involves three checks taken together: age adjustment, revisions to classification, and recording practice. The same disease can tell a different story depending on these three points alone.
Q1. Why Was the Tuberculosis Death Rate 187.2 per 100,000 in 1947?
In the years immediately after the Second World War, poor nutrition, crowded housing and gaps in medical care coincided in Japan, and tuberculosis infection spread to an extreme degree. In 1947 tuberculosis caused 146,241 deaths, accounting for 12.8% of all deaths recorded in the country that year.
The Tuberculosis Prevention Act was enacted in 1951, and over the same period drugs such as streptomycin entered clinical use, BCG vaccination spread and housing improved. The death rate fell quickly: fifth place in 1955 (52.3 per 100,000), single digits from the 1960s, and 1,462 deaths (1.2 per 100,000) in 2024. The decline is often described as one of the major public health developments of postwar Japan.
Q2. How Do Crude and Age-Adjusted Death Rates Differ in Use?
The crude death rate is the ratio of deaths to the whole population, and reflects the medical burden on society and the absolute number of deaths. The age-adjusted death rate is recalculated with the population’s age distribution fixed to a standard, such as the 1985 model population, and is used for individual risk and for comparisons across periods and regions.
In a rapidly ageing society such as Japan, the two can move in opposite directions. Between 1990 and 2024, the crude cancer death rate rose about 1.8 times, while the under-75 age-adjusted rate fell by about 30% over the same period. “Cancer deaths at a record high” rests on the crude rate; “cancer death risk in long-term decline” rests on the age-adjusted rate.
Q3. Which Other Causes Sit Close to the Top of the Rankings?
Dementia-related causes draw attention in this context. In the 2024 final data, Alzheimer’s disease ranked tenth (25,595 deaths, 21.3 per 100,000) and vascular and other dementia ranked eleventh (24,666 deaths). Combined, the two come to about 50,000 deaths, more than the 45,743 deaths from accidents, which ranked seventh.
Some observers point to Japan’s ageing population, the growing number of people with dementia and changes in how dementia is recorded on death certificates as factors behind the figures for this group. Cancer’s first place rests on a structure in which cases grow with the older population, so the absolute number of deaths keeps rising even as age-adjusted rates fall.
🔍 About the Fact-Check for This Article
Japan in Data fact-checks its articles. The evidence behind the fact-check for this page is set out below.