
The quickest way into the question “has Japan’s vacancy rate gone up?” is to set five surveys across 20 years next to a tile map of all 47 prefectures. Looking at the four types of vacant homes and the regional differences together with the overall rate shows what has been moving beneath a gradual headline figure.
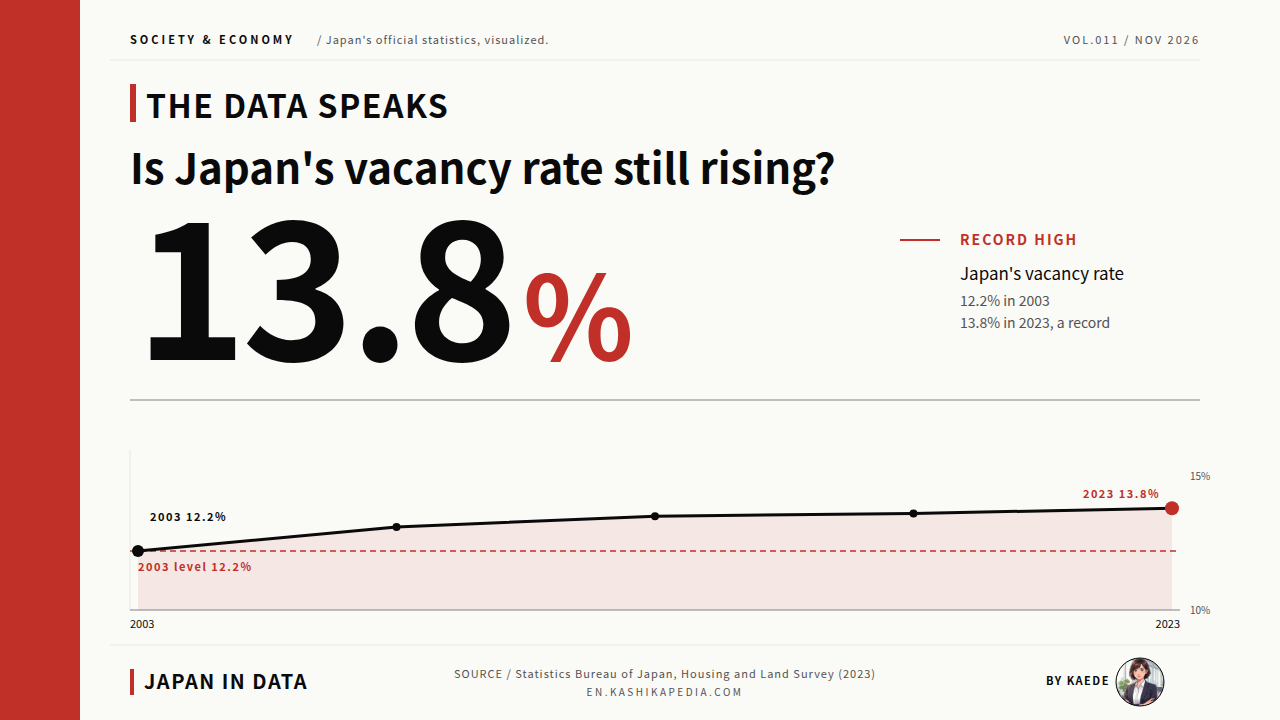
Japan’s vacancy rate reached 13.8% in 2023, the highest on record. According to the Housing and Land Survey by the Statistics Bureau of Japan, part of the Ministry of Internal Affairs and Communications, that is 1.6 points above the 12.2% recorded 20 years earlier, in 2003. Vacant homes rose from 6.59 million to 9.00 million, an increase of 2.41 million over the period.
One group has grown faster than the rest. Vacant homes that are not for rent, not for sale and not used as secondary homes, informally called “abandoned” vacant homes, rose about 1.8 times over the same 20 years, from 2.12 million to 3.85 million. They now make up 42.8% of all vacant homes in Japan.
This article works from the final figures of the 2023 Housing and Land Survey, released as preliminary housing counts on April 30, 2024 and as a basic tabulation on housing and households on September 25, 2024. The data is set out as a 20-year national line chart, a breakdown into four types, a 47-prefecture tile map and a 10-year comparison of the highest and lowest prefectures.
The final sections turn to the revised Vacant Houses Act, which took effect on December 13, 2023 under the Ministry of Land, Infrastructure, Transport and Tourism (MLIT), and to a private-sector forecast for 2043 published by Nomura Research Institute (NRI). Together they show where current projections place the next 20 years.
Japan’s vacant-home figures come from the Housing and Land Survey, conducted every five years by the Statistics Bureau of Japan. A vacant home, or akiya, is a dwelling with no resident household. The vacancy rate is vacant homes as a share of all dwellings. The survey sorts vacant homes into four types: for rent, for sale, secondary homes (holiday homes) and “other”. The “other” type, homes neither on the market nor used as secondary homes, is informally called “abandoned”. Japan has 47 prefectures, its top-level regions. Its fiscal year runs from April to March.
Japan’s vacancy rate went from 12.2% to 13.8% in 20 years. What changed, and what did not?
The overall rate rose gradually. “Abandoned” vacant homes grew 1.8 times in 20 years.
Figures are current as of the time of writing. Statistics, rules and services are subject to change, so please check the official sources for the latest information.
- Japan’s Vacancy Rate, 2003 to 2023: From 12.2% to a Record 13.8%
- Four Types of Vacant Homes: “Other” Vacant Homes Up About 1.8 Times
- Vacancy by Prefecture: Wakayama and Tokushima at 21.2%, Tokyo Area Near 10%
- Top 5 and Bottom 5 Over 10 Years: A Regional Gap That Has Persisted
- Dwellings Up 21%, Occupied Dwellings Up 19%: A Gap Widening Over 20 Years
- The 2023 Vacant Houses Act Revision and a 2043 Forecast: “Dangerous” Vacant Homes Projected to Double
- Kaede’s Summary: A Gradual Overall Rise, While “Other” Vacant Homes Grew About 1.8 Times
- Frequently Asked Questions
- 🔍 About the Fact-Check for This Article
Japan’s Vacancy Rate, 2003 to 2023: From 12.2% to a Record 13.8%
Plotting five surveys across 20 years as lines shows at a glance how the overall rate and the “other” vacancy rate relate. The two gently rising curves each reflect a different part of the housing stock.
* Compiled and edited by the Japan in Data editorial team based on official government statistics.
According to the Statistics Bureau’s Housing and Land Survey, the national vacancy rate rose in each of the five surveys across 20 years: 12.2% in 2003, 13.1% in 2008, 13.5% in 2013, 13.6% in 2018 and 13.8% in 2023. The 2023 figure is the highest on record, 1.6 points above 2003. Vacant homes rose from 6.59 million to 9.00 million, up 2.41 million, or 1.37 times.
Drawn as a separate line, the vacancy rate for homes other than rental, for-sale and secondary homes rises more steeply. It was 3.9% (2.12 million homes) in 2003 and 5.9% (3.85 million) in 2023, up 2.0 points and about 1.8 times. Even as the overall rate moved gradually, vacant homes held off the market and not in residential use rose from 3.9 to 5.9 for every 100 dwellings nationwide. The Nikkei newspaper reported the same measure in 2024 as “abandoned vacant homes up 1.8 times.”
In none of the five surveys did the vacancy rate fall below the previous reading. The surveys are taken at five-year intervals, so the series covers 2003, 2008, 2013, 2018 and 2023. Viewed over the long run, the rise has continued for 20 years as a sustained trend rather than a short-term fluctuation.
Four Types of Vacant Homes: “Other” Vacant Homes Up About 1.8 Times
Overlaying lines for the four types (for rent, for sale, secondary homes and other) on one chart shows which types grew and which shrank beneath the gradual rise in the overall rate.
* Compiled and edited by the Japan in Data editorial team based on official government statistics.
Split into four types, the 20-year movements differ sharply. Vacant homes for rent rose 20.6%, from 3.675 million in 2003 to 4.433 million in 2023. Homes for sale were roughly flat, up 7.9% from 303,000 to 327,000. Secondary homes such as holiday homes fell 23.1%, from 498,000 to 383,000.
By contrast, vacant homes not for rent, sale or secondary use, informally called “abandoned” vacant homes, rose 82.0% from 2.118 million to 3.853 million, about 1.8 times. Among the four types, only this group shows a sharp increase, standing well apart from the others across the 20 years. Of the 9.00 million vacant homes in 2023, 3.85 million, or 42.8%, belong to this group.
* Compiled and edited by the Japan in Data editorial team based on official government statistics.
The donut chart shows the 2023 composition. Homes for rent are the largest group at 49.3%, with “other” close behind at 42.8%. Secondary homes account for 4.3% and homes for sale for 3.6%. In 2003, the same four shares were 55.7% for rent, 32.1% other, 7.6% secondary and 4.6% for sale. Over 20 years the rental share fell and the “other” share rose by more than 10 points, moving the balance within the four types.
Vacancy by Prefecture: Wakayama and Tokushima at 21.2%, Tokyo Area Near 10%
Placing the vacancy rates of all 47 prefectures on one tile map makes the geographic pattern visible at a glance. The colours outline two poles: western Japan and depopulating areas on one side, the Tokyo area on the other.
* Compiled and edited by the Japan in Data editorial team based on official government statistics.
In 2023, the highest vacancy rates were in Wakayama and Tokushima prefectures, both at 21.2%, followed by Yamanashi at 20.5%, Kagoshima at 20.4%, Kochi at 20.3% and Nagano at 20.0%. Six prefectures stand at 20% or more. Looking down to tenth place, the list is concentrated in western Japan, in the Shikoku, Kyushu and Chugoku regions.
At the other end, Okinawa has the lowest rate at 9.3%, followed by Saitama at 9.4%, Kanagawa at 9.8%, Tokyo at 11.0% and Aichi at 11.8%. The 11.9-point gap between Wakayama and Tokushima (21.2%) and Okinawa (9.3%) puts the highest rate at more than twice the lowest. Four of the bottom five lie in metropolitan areas with concentrated populations. Some observers link the lower rates in these areas to continued population inflows.
Grouped by region, the simple average of prefecture rates is 19.95% for the four Shikoku prefectures (Tokushima 21.2, Ehime 19.8, Kochi 20.3, Kagawa 18.5) and 15.13% for the six Tohoku prefectures (Aomori 16.7, Iwate 17.3, Miyagi 12.4, Akita 15.7, Yamagata 13.5, Fukushima 15.2). For the seven Kanto prefectures (Ibaraki 14.1, Tochigi 16.9, Gunma 16.7, Saitama 9.4, Chiba 12.3, Tokyo 11.0, Kanagawa 9.8) it is 12.89%. Rates vary within each region, but a clear gradient appears at the regional level too.
Top 5 and Bottom 5 Over 10 Years: A Regional Gap That Has Persisted
Showing the 10-year paths (2013, 2018, 2023) of the top five and bottom five in separate panels shows whether the gap narrowed or widened. The chart compares the starting point ten years ago with where each group stands today.
* Compiled and edited by the Japan in Data editorial team based on official government statistics.
The five prefectures with the highest rates in 2023 (Wakayama, Tokushima, Yamanashi, Kagoshima and Kochi) were already at high levels of 17% to 22% in 2013. Wakayama rose from 18.1% in 2013 to 20.3% in 2018 and 21.2% in 2023, and Tokushima from 17.5% to 19.4% and 21.2%. Yamanashi moved the other way, easing from 22.0% to 21.3% and 20.5%, so the top group did not move uniformly.
The bottom five (Okinawa, Saitama, Kanagawa, Tokyo and Aichi) all stayed within a narrow band of 9% to 12% over the decade. Okinawa went from 10.4% to 10.2% and 9.3%, and Saitama from 10.9% to 10.2% and 9.4%, so some even fell over ten years. The gap between the top and bottom groups has not narrowed in ten years, and the regional difference already visible in 2013 has continued.
The simple average for the top five rose from 18.5% in 2013 to 20.7% in 2023, while the bottom five fell from 11.1% to 10.3%. With the top group edging up and the bottom group edging down, the gap between the two averages widened slightly over the decade, from about 7.4 points to 10.4 points. The regional difference has moved toward slow widening rather than narrowing.
Dwellings Up 21%, Occupied Dwellings Up 19%: A Gap Widening Over 20 Years
Plotting total dwellings and occupied dwellings on one chart, with the gap between them shaded in vermilion, shows how the housing stock and the number of lived-in homes have diverged over 20 years.
* Compiled and edited by the Japan in Data editorial team based on official government statistics.
Total dwellings rose from 53,890,000 in 2003 to 65,020,000 in 2023, an increase of 11.13 million (20.7%). Occupied dwellings, those with a resident household, rose from 46.86 million to 55.65 million, an increase of 8.79 million (18.8%). Throughout the 20 years, the number of dwellings grew faster than the number of occupied dwellings.
The difference between the two widened from 7.03 million in 2003 to 9.37 million in 2023, an increase of 2.34 million. This difference corresponds to dwellings without a resident household, roughly vacant homes plus homes under construction and similar. The 9.00 million vacant homes of 2023 sit within a gap that accumulated over 20 years in which dwellings consistently grew faster than occupied dwellings.
Housing starts have slowed. An NRI estimate published on June 13, 2024 projects new housing starts of 580,000 in fiscal year 2040, about 27% below fiscal year 2023. A lower level of starts is a separate question from whether dwellings continue to grow faster than occupied dwellings. The size of that gap also reflects how many existing homes are demolished each year.
The 2023 Vacant Houses Act Revision and a 2043 Forecast: “Dangerous” Vacant Homes Projected to Double
Setting the policy response next to the forecast for 20 years ahead connects where things stand now with where projections place them. This last section lays out both side by side.
The Act Partially Amending the Act on Special Measures Concerning the Promotion of Measures for Vacant Houses (Act No. 50 of 2023), which falls under MLIT, took effect on December 13, 2023. It created a new category of “poorly managed vacant houses” (kanri fuzen akiya). Previously, municipalities acted on “specified vacant houses” (tokutei akiya), those judged to be at risk of collapse or similar hazards.
Under the revision, municipalities can issue guidance and recommendations at an earlier stage, when a house left as it is could become a specified vacant house. If a poorly managed vacant house receives a recommendation, its land may lose the residential-land exception in fixed asset tax, which reduces the taxable base to one-sixth for up to 200 m² of land. The rule ties the tax treatment of the land to how the house is maintained.
For the 20 years ahead, NRI published a report on June 13, 2024 titled “The Housing Market and Its Challenges in 2040: Fears of a Doubling of Dangerous Vacant Homes as the Vacant-House Issue Enters a New Stage.” Using the final 2023 survey results, NRI estimated vacant-home counts and rates for 2028 to 2043. NRI’s private-sector estimate puts the vacancy rate at about 25%, or one in four homes, in 2043.
By building type, NRI projects vacancy rates for apartment buildings and row houses to decline, while vacant single-family homes rise sharply to 2.6 times the 2023 level by 2043. Vacant single-family homes have a relatively high share with decay or damage. NRI estimates that decayed or damaged single-family vacant homes, which raise larger safety concerns, rise from 820,000 in 2023 to 1.65 million in 2043, about double.
According to NRI, the core of the forecast is that while growth in the total number of vacant homes slows, a rise in “dangerous” vacant homes emerges as a new issue. NRI describes this as the vacant-house problem moving to its next stage, with the question of preparing for the coming 20 years at its centre.
Kaede’s Summary: A Gradual Overall Rise, While “Other” Vacant Homes Grew About 1.8 Times
With the national trend, the four-type breakdown and the differences across 47 prefectures laid out, the 20 years of vacancy data can be summarised as three observations.
The question was this: the vacancy rate went from 12.2% to 13.8% in 20 years, so what changed and what did not? The charts in this article show that, beneath the gradual rise in the overall rate, a shift in the breakdown and a persistent regional gap have unfolded together. The time window, the category and the region each tell a different story; the aim here is to record those differences as observations, not to rank the data.
Read together, the three observations place today’s 13.8% at the end of 20 years in which a gradual rise in rental vacancies, a sharp rise in “other” vacant homes, dwellings growing faster than occupied dwellings and a persistent regional gap all accumulated. The answer to whether the vacancy rate has risen changes depending on whether one looks at the overall rate, the breakdown or a particular region. NRI’s estimate of about 25% in 2043 adds a reference point linking the present with the next 20 years.
Frequently Asked Questions
A vacancy rate is easier to read with three things in view together: the survey scope, the category and the geographic unit. With the same data, a change in any one of the three changes the story the figures tell.
Q1. Which Prefecture Has the Highest Vacancy Rate?
In the 2023 Housing and Land Survey, Wakayama and Tokushima tie for first at 21.2%. Yamanashi (20.5%), Kagoshima (20.4%), Kochi (20.3%) and Nagano (20.0%) follow, making six prefectures at 20% or more. In 2023, more prefectures were above the national average of 13.8% than below it. Those below include Okinawa (9.3%), Saitama (9.4%), Kanagawa (9.8%), Tokyo (11.0%), Aichi (11.8%), Shiga (12.1%), Chiba (12.3%), Fukuoka (12.3%), Miyagi (12.4%) and Kyoto (13.1%).
Q2. What Are “Abandoned” Vacant Homes, and How Do They Differ From the Vacancy Rate?
“Abandoned vacant homes” is an informal term. In the statistics it refers to vacant homes excluding those for rent, for sale and secondary homes such as holiday homes: homes that are not on the rental or sales market, are not holiday homes and are not in residential use. In 2023 there were 3.85 million nationwide, 42.8% of all 9.00 million vacant homes.
The group grew 1.8 times from 2.12 million in 2003 (shown as 212 in the survey tables, which count in units of ten thousand homes), the largest increase among the four types and the main feature of the rising vacancy curve. In official usage by MLIT and the Ministry of Internal Affairs and Communications, it is called “vacant homes excluding those for rent, sale and secondary use” or “other housing”; “abandoned vacant homes” is not an official term.
Q3. What Is the Outlook for the Vacancy Rate?
According to an estimate published by NRI in June 2024, the vacancy rate reaches about 25% (one in four homes) in 2043, 20 years on (private-sector estimate). By building type, NRI projects vacancy rates for apartments and row houses to decline, while vacant single-family homes rise sharply to 2.6 times the 2023 level by 2043.
NRI estimates that decayed or damaged single-family vacant homes, which raise larger safety concerns, rise from 820,000 in 2023 to 1.65 million in 2043, about double. NRI calls this the problem of rising “dangerous” vacant homes and describes the vacant-house issue as moving to its next stage.
🔍 About the Fact-Check for This Article
Japan in Data fact-checks its articles. The evidence for the fact-check on this page is listed below.