
The number people look for as Japan’s “lifetime unmarried rate” is now officially called the “share never married at age 50”. Placing the lines for men and women next to a bar chart of the gap between them shows the shape of 55 years of change.
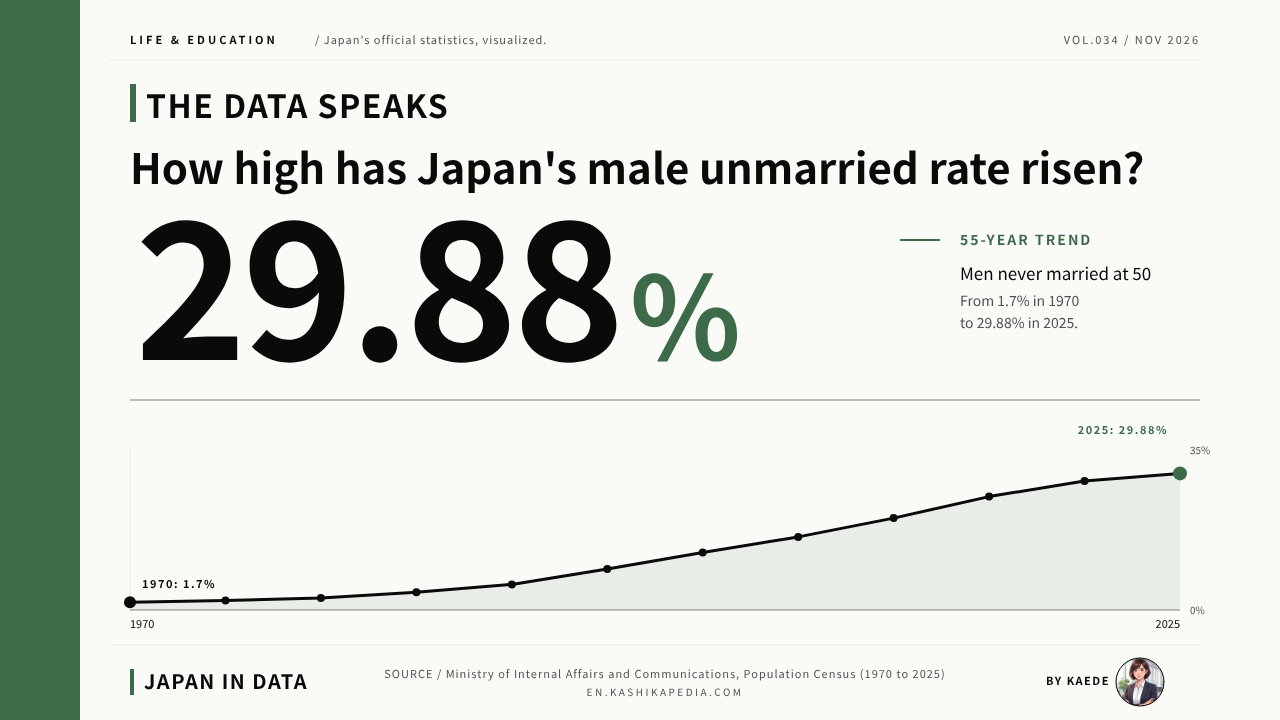
The figure long known in Japan as the lifetime unmarried rate stood at 29.88% for men and 19.58% for women in 2025. In 1980 it was 2.60% for men and 4.45% for women, so women were higher at the time. Over 55 years the two positions reversed, and the gap widened to 10.44 points in 2020. In 2025 the gap was 10.30 points, the first narrowing since men moved above women in 1990.
Expressed as people, the 2025 shares work out to roughly 1 in 3.3 men and roughly 1 in 5.1 women (100 ÷ 29.88 and 100 ÷ 19.58). The current official name of the indicator is the share never married at age 50. It is calculated as the average of the never-married shares for ages 45 to 49 and ages 50 to 54.
This article sets out in charts the trend from 1970 to 2025, the movement of the gender gap itself, how the indicator is built, never-married shares in the 20s and 30s, and the growth multiple since 1980. Figures up to 2020 follow published values from sources such as the Latest Demographic Statistics of the National Institute of Population and Social Security Research (IPSS). The 2025 figures were calculated by the editorial team from the 2025 Population Census, released on September 29, 2026, using the same method.
Japan’s Population Census is conducted every five years by the Statistics Bureau of the Ministry of Internal Affairs and Communications; the latest was held on October 1, 2025. The term shogai mikonritsu, often translated as the lifetime unmarried rate, is now officially called the share never married at age 50. It is the average of the never-married shares for ages 45 to 49 and 50 to 54. People who are divorced or widowed are counted as having married. Figures here follow census years, not fiscal years.
How high has Japan’s lifetime unmarried rate risen?
In 2025: men 29.88%, women 19.58%. The gender gap narrowed for the first time since 1990.
Figures are current as of the time of writing. Statistics, rules and services are subject to change, so please check the official sources for the latest information.
- How Far Has the Share Never Married at 50 Risen in 55 Years?
- What the “Lifetime Unmarried Rate” Actually Counts
- When Men and Women Swapped Places, and How Wide the Gap Grew
- How the Unmarried Share in the 20s and 30s Has Moved
- Comparing Growth Since 1980 for Men and Women
- What 29.88% Looks Like in People
- Kaede’s Summary: The Gender Gap Narrowed for the First Time Since 1990
- Frequently Asked Questions
- 🔍 About the Fact-Check for This Article
How Far Has the Share Never Married at 50 Risen in 55 Years?
Drawing 12 censuses as a single line chart shows that the rise took a different shape for men and for women. The points sit five years apart because the census behind the calculation is held every five years.
* Compiled and edited by the Japan in Data editorial team based on official government statistics.
In 1970, the share never married at 50 was 1.7% for men and 3.3% for women. In 1980 it was 2.60% for men and 4.45% for women, both still below 5%. Through the 1970s, the share stayed in the low single digits for both men and women, and the two lines sat close together.
From the 1990s, the line for men grows steeper. It reached 9.0% in 1995, 12.6% in 2000, 16.0% in 2005 and 20.1% in 2010, rising by about 3 to 4 points every five years. The share for men then stood at 24.8% in 2015, 28.25% in 2020 and 29.88% in 2025.
The line for women stayed close to flat, in the 3% to 4% range, from 1970 to 1990, and turned upward after reaching 5.1% in 1995. It passed 10% for the first time in 2010 at 10.6%, then stood at 14.9% in 2015, 17.81% in 2020 and 19.58% in 2025. The different starting points of the rise appear as the different shapes of the two lines.
To compare 2020 with 2025, the method for imputing unreported answers is aligned. Re-imputed with the 2025 method, the 2020 values are 28.46% for men and 17.90% for women, so over these five years the share rose 1.42 points for men and 1.68 points for women. Over these five years, the rise was larger for women than for men.
What the “Lifetime Unmarried Rate” Actually Counts
This figure does not count only people who are exactly 50. The chart below shows first which values are combined, and how.
* Compiled and edited by the Japan in Data editorial team based on official government statistics.
IPSS labels this indicator the share never married at age 50 and notes that it was formerly also called the lifetime unmarried rate. It is calculated as the average of the never-married shares for ages 45 to 49 and ages 50 to 54. Both age groups come from the same Population Census.
The figure therefore shows the share of people who have never married as of age 50. It does not directly show the share of people who remain unmarried for their whole lives. The denominator is the population by age, and the treatment of people whose marital status is not reported differs by census year.
Values from 2015 onward are calculated from figures with unreported marital status imputed. The share is updated at five-year intervals, in step with the Population Census used in the calculation. Figures with different calculation methods circulate under the same label in official documents and news reports, so this article uses this single definition throughout.
The 2025 values do not yet appear in the IPSS compilation, so the editorial team calculated them by the same method from the imputed values of the 2025 Population Census. The same procedure reproduces the published 2020 values of 28.25% for men and 17.81% for women. Values by age group for the 20s and 30s use a different basis: unadjusted counts with unreported marital status excluded from the denominator.
When Men and Women Swapped Places, and How Wide the Gap Grew
With two lines side by side, the movement of the gap itself is hard to read. The chart below plots only the value for men minus women, as bars that cross the zero line.
* Compiled and edited by the Japan in Data editorial team based on official government statistics.
The gap was minus 1.6 points in 1970 and minus 2.2 points in 1975, with the share for women higher in both years. In 1980 it was minus 1.85 points. By 1985 the gap had narrowed to minus 0.4 points, and the shares for men and women were nearly level.
In 1990 the gap reached plus 1.3 points, and the share for men moved above the share for women for the first time in the series shown. The sign of the gap changed between 1985 and 1990. From then until 2020, the gap widened at every census without narrowing once.
The gap was plus 3.9 points in 1995, plus 6.8 in 2000, plus 8.7 in 2005, plus 9.5 in 2010, plus 9.9 in 2015, plus 10.44 in 2020 and plus 10.30 in 2025. Compared with minus 1.85 points in 1980, the sign has changed over 45 years, and the size of the gap has also grown.
The 2025 gap is 0.14 points smaller than in 2020, the first time it has come in below the previous census since men moved higher in 1990. Against the 2020 gap re-imputed with the 2025 method (10.56 points), it narrowed by 0.26 points. Under either comparison the narrowing is under 1 point, and the gap remains within the 9.5 to 10.44 point range seen since 2010.
How the Unmarried Share in the 20s and 30s Has Moved
The share at 50 sits at the end of what happens at younger ages. The chart shows three lines, ages 25 to 29, 30 to 34 and 35 to 39, in separate panels for men and for women.
* Compiled and edited by the Japan in Data editorial team based on official government statistics.
For men aged 25 to 29, the share rose from 46.5% in 1970 to 73.8% in 2025. For ages 30 to 34, it rose steadily from 11.7% in 1970 to 47.1% in 2005, stayed in the 47% range through 2020, and reached 49.0% in 2025. For men in their early 30s, the share was almost flat from 2005 to 2020, then rose 1.6 points in 2025.
Men aged 35 to 39 stood at 35.6% in 2010, then declined to 35.0% in 2015 and 34.5% in 2020. In 2025 the share was 37.4%, the highest since 1970. For women, 2025 was the highest year in all three age groups: 65.8% for ages 25 to 29, 38.0% for 30 to 34 and 26.6% for 35 to 39.
The 2025 values in this chart were calculated by the editorial team from unadjusted 2025 Population Census counts, with unreported marital status excluded from the denominator. That is the same basis used for the 1970 to 2020 values in the White Paper on Children, and it differs from the imputed basis used for the share at 50.
Comparing Growth Since 1980 for Men and Women
Even when both shares rose, the size of the rise depends on the starting point. Taking 1980 as 1, the chart shows how many times higher 2025 is for men and for women.
* Compiled and edited by the Japan in Data editorial team based on official government statistics.
For men, the share rose from 2.60% in 1980 to 29.88% in 2025, about 11.5 times (29.88 ÷ 2.60). For women, it rose from 4.45% to 19.58%, about 4.4 times (19.58 ÷ 4.45). Although women started from a higher level, the multiple is larger for men.
Measured in points, the rise was 27.28 points for men and 15.13 points for women. The contrast between men and women reads differently depending on whether multiples or point differences are used. Both comparisons use values calculated by the same method, the average of ages 45 to 49 and 50 to 54, though the treatment of unreported marital status differs by year.
What 29.88% Looks Like in People
Percentages are hard to picture, so the chart below converts them to a group of 40 people. After that, a table lets you check every figure from 1970 to 2025.
* Compiled and edited by the Japan in Data editorial team based on official government statistics.
On the 2025 shares, out of 40 people, about 12 men (40 × 0.2988) and about 8 women (40 × 0.1958) would have never married by age 50. Dividing 100 by 29.88 gives about 3.3, and dividing 100 by 19.58 gives about 5.1. These are the basis of the 1 in 3.3 and 1 in 5.1 figures used above.
The table below switches between men, women and the gender gap, showing the values at 12 census points from 1970 to 2025. The gap figures were calculated by the editorial team, using two-decimal values for 1980, 2020 and 2025 (the 2025 shares are also editorial calculations).
* Compiled and edited by the Japan in Data editorial team based on official government statistics.
The 2025 Population Census was held on October 1, 2025, and its Basic Complete Tabulation on Population and Households was released on September 29, 2026, together with values imputing unreported marital status. The 2025 figures are the editorial team’s average of the never-married shares at ages 45 to 49 and 50 to 54 from those imputed values. The same release includes 2020 values re-imputed with the 2025 method, which give 28.46% for men and 17.90% for women, slightly different from the published 2020 values in the table.
Three related subjects are outside the scope of this article: the changing age structure shown by Japan’s population pyramid, the 126-year record of annual births, and the gender gap in housework time among dual-income households. Each of these draws on different official statistics and is treated as a separate subject from the share never married at 50.
Kaede’s Summary: The Gender Gap Narrowed for the First Time Since 1990
Laying the charts side by side again shows that the level and the gap can be read separately. Here they are, set out as three observations.
Combining the 55-year trend, the sign of the gender gap and the movement by age group shows that the same phrase, “the unmarried share rose”, describes different shapes for men and for women. The following is a summary of facts drawn from published values and from the 2025 values the editorial team calculated by the same method.
Taken together, the three observations show that the level and the width of the gap have moved separately. The gap went from 1.85 points with women higher in 1980 to 10.30 points with men higher in 2025. The gap narrowed slightly in 2025, while the level for both men and women was higher than in 2020. The answer to how far the lifetime unmarried rate has risen can be stated in two numbers: a level of 29.88% for men and 19.58% for women, and a gap of 10.30 points.
Frequently Asked Questions
The name and the method of this indicator are easy to misread. Below are the three most common questions, answered from the wording of the primary sources.
Q1. Are the “Lifetime Unmarried Rate” and the “Share Never Married at 50” Different?
They refer to the same figure. IPSS uses the label share never married at age 50 and notes that the indicator was formerly also called the lifetime unmarried rate. It is calculated as the average of the never-married shares for ages 45 to 49 and ages 50 to 54, both taken from the Population Census.
Q2. How Recent Is the Latest Figure?
The latest figure is for 2025. The editorial team calculated it as the average of the never-married shares at ages 45 to 49 and 50 to 54, from imputed values of the 2025 Population Census released on September 29, 2026. The IPSS Latest Demographic Statistics does not yet include the 2025 value. The share is based on the Population Census, so it is updated every five years.
Q3. Does Being Unmarried at 50 Mean Never Marrying Later?
The indicator shows the share of people who have never married as of age 50. It does not directly show the share of people who remain unmarried throughout their lives. The calculation uses the average of the never-married shares for ages 45 to 49 and ages 50 to 54.
🔍 About the Fact-Check for This Article
Japan in Data fact-checks its articles. The evidence for the fact-check of this page is set out below.