
The quickest way into the question of whether divorce in Japan is really rising is to set two charts side by side: the postwar trend across 80 years and the divorce rate by age group. With the long decline and the recent rebound on one page, a less visible shift comes into view: the total is falling while divorce after long marriages is growing.
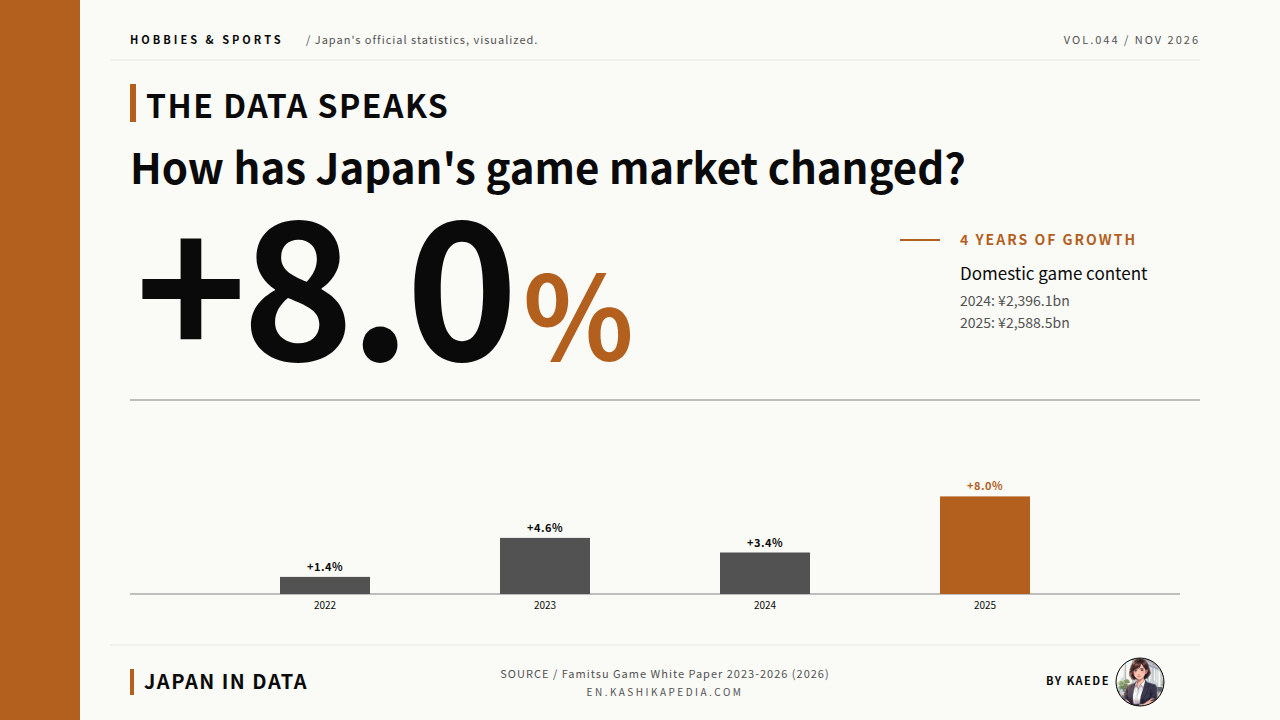
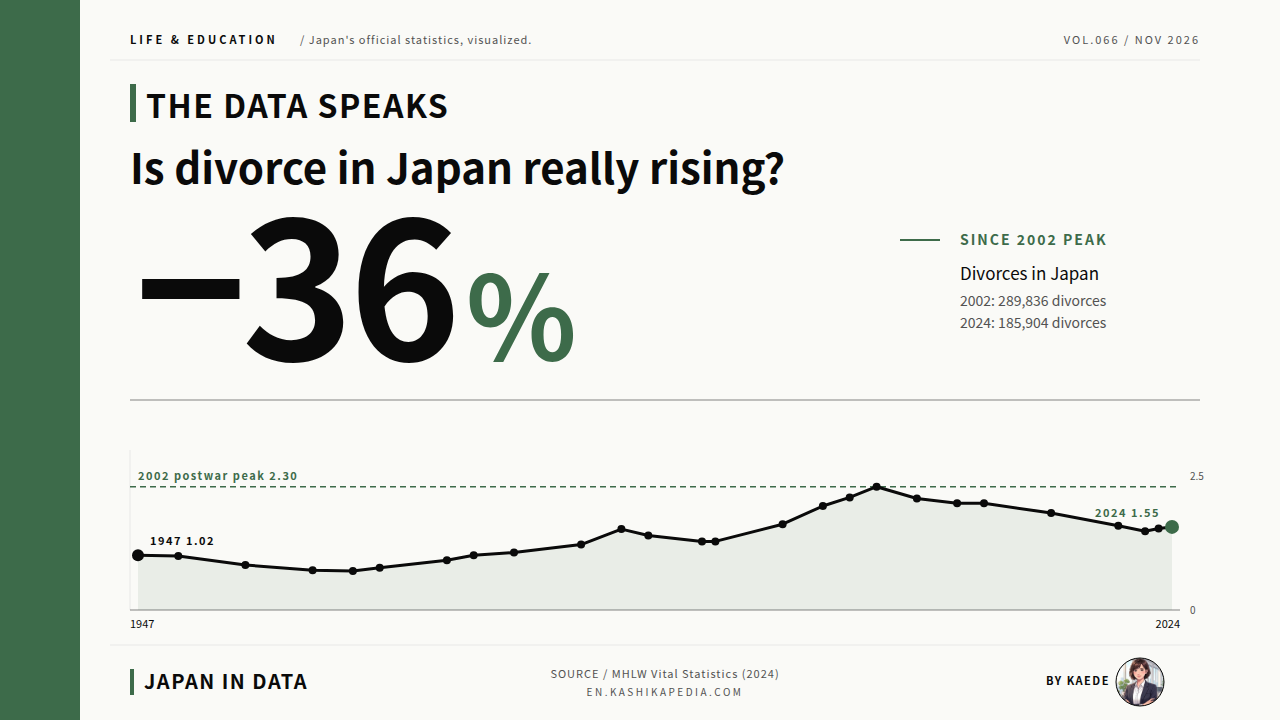
Many people in Japan feel that divorce is becoming more common, yet the official data show a long-run decline. According to the Vital Statistics of the Ministry of Health, Labour and Welfare (MHLW), divorces peaked at 289,836 in 2002 and then trended down. In 2024 there were 185,904 divorces, a rate of 1.55 per thousand population, about 64% of the peak level.
Since 2023, however, the number has risen for two consecutive years, and 2024 was up 2,090 on the previous year. A large long-run decline and a rebound over the latest two years are running at the same time, and that is the current shape of divorce in Japan.
This article works from primary sources: the MHLW’s Vital Statistics 2024 (final data), its special report Statistics on Divorce, and prefecture-level data on e-Stat, the government statistics portal. The figures are set out in a trend chart, a 47-prefecture tile map, a stacked area chart by length of marriage and other charts, to observe how the picture of divorce in Japan has changed over the postwar decades.
Japan’s divorce figures come from the Vital Statistics compiled by the Ministry of Health, Labour and Welfare, which count divorces registered in each calendar year. The headline divorce rate is the number of divorces per thousand population. Most divorces are kyogi rikon, divorce by agreement: the couple files a form at the local government office without going to court. The rest pass through the family court. Prefectures are Japan’s 47 top-level regions, from Hokkaido in the north to Okinawa in the south.
Is divorce in Japan really rising?
Divorces are down about 36% from the 2002 peak, but have risen for two years in a row.
Information in this article is current as of the time of writing. Figures, rules and services are subject to change, so please check each official source for the latest information.
- 78 Years of Divorce in Japan: The Curve Through Four Milestones
- Divorce Rates Across 47 Prefectures in 2024: Okinawa 2.24, Toyama 1.13
- Divorce by Years Together: The Under-5 Share Shrinks, the 20-Plus Share Grows
- Divorce by Type: About 88% Are Settled by Agreement
- Where One in Three Comes From: Divorce-to-Marriage Ratio vs. Crude Rate
- Divorce Rates by Age, 1980 to 2024: Falling for the Young, Rising for the Old
- Kaede’s Summary: Long-Run Decline, Regional Gaps and Late-Life Divorce
- Frequently Asked Questions
- 🔍 About the Fact-Check for This Article
78 Years of Divorce in Japan: The Curve Through Four Milestones
Across 78 years, a line chart lines up the peaks, the trough and the current position faster than a table. After two peaks and one trough, the shape of the curve shows where the figure stands now.
* Compiled and edited by the Japan in Data editorial team based on official government statistics.
According to the MHLW’s Vital Statistics, the series begins in 1947 with 79,551 divorces (a rate of 1.02), and the number then declined gradually through the postwar recovery years. In 1963 the rate reached 0.73, the lowest of the postwar period, which is the first milestone. From 1964 the number rose every year, and in 1983 the rate reached 1.51, a first smaller peak.
The decline that began in 1984 was temporary. The rate turned upward again, and in 1998 it reached 1.94, the highest level since the national series began in the Meiji era. This second climb continued in the years that followed and led to the largest peak of the postwar period, which forms the next milestone in the series.
In 2002 the number reached 289,836 and the rate 2.30, the largest peak since the Second World War. This is the third milestone and the top of the postwar rise in divorce. From 2003 the figures entered a declining phase, and in the 2010s the annual number of divorces fell into the low 200,000s.
In 2020, the year COVID-19 spread, there were 193,253 divorces (a rate of 1.57). In 2022 the figure was 179,099 (1.47), the most recent low. The number then rose again in 2023 and 2024, reaching 185,904 and a rate of 1.55 in 2024. This is the fourth milestone, the present position within the long-run trend.
Against the 2002 peak, the 2024 level stands at about 64%, yet it has risen for two consecutive years and is recovering from the low. Placed side by side, the official figures show two movements at once: a large decrease over 22 years, and a rebound from the bottom over the latest two years.
Divorce Rates Across 47 Prefectures in 2024: Okinawa 2.24, Toyama 1.13
For differences across 47 prefectures, a tile map brings out geographic patterns that a table or bar chart can hide. Where the darker tiles cluster can be seen at a glance.
* Compiled and edited by the Japan in Data editorial team based on official government statistics.
In the 2024 final data, the divorce rate per thousand population was highest in Okinawa Prefecture at 2.24 and lowest in Toyama Prefecture at 1.13, a gap of about 2.0 times. Okinawa stands at about 1.45 times the national average of 1.55 and Toyama at about 0.73 times, a wide spread within a single country.
The five highest rates were in Okinawa (2.24), Osaka Prefecture (1.79), Fukuoka Prefecture (1.79), Hokkaido (1.76) and Miyazaki Prefecture (1.74). On the tile map, the darker shades appear mainly in Kyushu, Shikoku and Hokkaido, together with the large metropolitan areas, which tend to sit at the higher end of the range.
At the other end are Toyama (1.13), Akita Prefecture (1.17) and Yamagata Prefecture (1.18), in the Hokuriku region and on the Sea of Japan side of Tohoku. Niigata, Fukui and Ishikawa, also on the Sea of Japan coast, tend to be low as well. Some observers link this to family structure, such as the high share of three-generation households in Hokuriku.
Tokyo stands at 1.52, 20th in the country and level with the national average of 1.55, so an urban prefecture does not necessarily show an unusually high rate. By number of divorces, populous Tokyo, Osaka and Kanagawa Prefecture rank high, but the order changes considerably once the figures are expressed per thousand population.
The rate per thousand is less affected by population size and is said to reflect local culture and economic structure around marriage and divorce. Single-year prefectural values, however, can fluctuate when compared over time. The next section turns to an axis separate from regional differences: how long couples had lived together before they divorced.
Divorce by Years Together: The Under-5 Share Shrinks, the 20-Plus Share Grows
Shares by length of cohabitation slice each year’s divorces by how many years the couple had lived together. Laid out as a 100% stacked area chart, the changing thickness of each layer shows the mix moving over time.
* Compiled and edited by the Japan in Data editorial team based on official government statistics.
Set out as a stacked area chart from 1950 to 2024, the shares by length of cohabitation show two large changes. The most visible concerns divorces after less than five years together: their share peaked at 40.1% in 1997 and fell to 27.8% in 2024. A 12.3-point fall in the share of early divorces over about 30 years is a sizable shift for a composition measure.
Some observers link this to later marriage overall and to the falling number of marriages among young people. The second change runs in the opposite direction. Divorces after 20 or more years together accounted for about 12% in the 1950s and 22.9% (40,686 divorces) in 2024, roughly double over about 75 years.
This is what is often called jukunen rikon, or late-life divorce: the long-term rise in divorces between couples who have lived together for decades, often after their child-rearing years are largely behind them. Their share of all divorces has grown steadily across the period shown in the chart.
Taken together, the shares show that although total divorces have fallen since 2002, the breakdown has moved in one direction: a smaller share of young couples separating after a short marriage and a larger share of long-married couples separating. The same word, divorce, has covered a changing mix over about 75 years. The next section looks at how divorces are finalized.
Divorce by Type: About 88% Are Settled by Agreement
Shares by type of divorce show institutional features that counts and rates do not. Laid out as 100% stacked bars, they form a stable shape that has held throughout the postwar period.
* Compiled and edited by the Japan in Data editorial team based on official government statistics.
By type, divorces in 2024 broke down as follows: by agreement 162,682 (87.5%), by mediation 14,260 (7.7%), by adjudication 4,626 (2.5%), by trial 1,948 (1.0%), by settlement 2,378 (1.3%) and by acceptance of claim 10 (0.0%). Mediation, adjudication and trial take place in court when a couple cannot reach agreement between themselves.
Divorce by agreement, which takes effect when a couple submits a divorce form after discussing it between themselves, accounts for about 88% of the total, a feature of Japan’s divorce system that has held throughout the postwar period. The routes through the family court together make up only about 12%.
In the 1950s, about 96% of divorces were by agreement and mediation and court-based routes together came to about 4%. Over about 75 years the share by agreement has fallen by roughly 8 points, and mediation, adjudication and trial have grown slightly. The structure in which nearly all divorces are settled by agreement has not changed greatly.
Divorce by agreement has remained the main type throughout: in the 1950s, when annual divorces were in the 100,000s, in 2002, at the peak of just under 290,000, and in 2024, at just under 190,000. The total number of divorces changed considerably across these periods, but the leading type in the composition did not.
Divorce by agreement does not require legal grounds. If both spouses agree, the divorce takes effect when they submit the form to their local government office. This differs from systems in parts of the United States and Europe, where a court must establish grounds for divorce. Japan’s arrangement is often described as close to unique in this respect.
The pattern in which counts change while shares stay stable is an important premise for reading divorce figures in Japan. The next section uses a different measure, the ratio of divorces to marriages, to check the basis of the often-quoted claim that one in three marriages in Japan ends in divorce.
Where One in Three Comes From: Divorce-to-Marriage Ratio vs. Crude Rate
The expression that one in three couples divorce does rest on a calculation. That calculation, however, is also a simple division that sets the year’s marriages directly against the year’s divorces.
* Compiled and edited by the Japan in Data editorial team based on official government statistics.
The figure most often cited for the claim that one in three couples in Japan divorce is the ratio of divorces to marriages, known in Japanese statistics as the special divorce rate. It divides the number of divorces in a year by the number of marriages in the same year. For 2024 it was 185,904 ÷ 485,063 = 38.3%.
By this simple division, the number of couples who divorced in 2024 equals a little over one-third of the number of couples who married that year. The ratio was about 21.8% in 1990 and trended upward from the 1990s. It reached 38.3% in 2002, a peak at the time, and has since moved around 37%.
The ratio does not mean that three in ten couples who married in a given year will divorce. The couples counted in the denominator (marriages) and in the numerator (divorces) are different people. The denominator has also shrunk over the long run, from about 1.1 million marriages in 1972 to about 480,000 in 2024, a decline that pushes the ratio upward.
A more precise reading of one in three requires the MHLW’s estimates of lifetime marriages and divorces. In a special report of the Vital Statistics, the ministry adds up age-specific marriage and divorce rates across a whole lifetime to estimate the probability that a person marries and divorces.
In the estimate for 2020, the average number of marriages per person over a lifetime was 0.79 for men and 0.84 for women, and the average number of divorces was 0.26 for men and 0.27 for women. Dividing divorces by marriages gives 0.33 for men and 0.32 for women, both about one-third, close to the one-in-three expression.
Meanwhile, the crude divorce rate per thousand population was 1.55 in 2024, back to a level comparable with the early 1990s (around 1.28). Measured per head of population, divorce has declined. A different picture, in which divorce relative to population is falling, therefore holds at the same time as the one-in-three figure.
Divorce Rates by Age, 1980 to 2024: Falling for the Young, Rising for the Old
Divorce rates by age group show changes running in opposite directions across generations at the same time: falling among younger women and rising among middle-aged and older women.
* Compiled and edited by the Japan in Data editorial team based on official government statistics.
Laid out from 1980 to 2024, divorce rates by the wife’s age group (per thousand wives) move very differently by generation. For wives aged 25 to 29, the rate peaked at 16.0 in 2000 and fell to 12.5 in 2024. For ages 30 to 34, it peaked at around 12.5 in the 2010s and has edged down since.
Among younger age groups as a whole, the rate has leveled off or declined gradually. The decline in divorce rates among younger women has run alongside a decline in marriage rates in the same age groups. Some observers note that fewer young marriages leave fewer young couples in a position to divorce.
The opposite movement appears among women in their 50s and older. For wives aged 50 to 54, the rate rose from 1.5 in 1980 to 4.5 in 2024, about three times higher. For ages 60 to 64 it rose from 0.7 to 2.8, about four times higher over the same period.
Divorce among long-married couples has grown steadily in rates as well as in numbers. This is the long-term rise in late-life divorce, and it is consistent with the growing share of divorces after 20 or more years together, from about 12% in the 1950s to 22.9% in 2024.
Changes in opposite directions across generations make it hard to give a single answer to whether divorce in Japan is falling or rising. The total is down about 36% from 2002, and the crude rate per thousand has returned to early-1990s levels. Within those totals, a decline among younger couples and a rise among older ones have overlapped. The next section sets out what the six charts show as observations.
Kaede’s Summary: Long-Run Decline, Regional Gaps and Late-Life Divorce
The structure that emerged from the six charts so far is set out here as three observations. They are not judgments, only the facts the data show, laid out plainly.
On the question of how Japan’s divorce rate has moved over the postwar decades, the charts in this article show three different axes, the long-run trend, regional differences and age structure, each telling a different story. The period, the region and the age group chosen each lead to a different conclusion. Rather than ranking the data, the differences are set out here as observations.
Read together, the three observations describe divorce in Japan today as three movements at once: a long-run decline in the total, regional differences across the map, and a reversal between generations in the age structure. The simple answer to whether divorce has risen or fallen changes with the measure, the period and the generation being examined. That observation itself summarizes the postwar picture of divorce in Japan.
Frequently Asked Questions
When reading a divorce-rate chart, check three things together: the period chosen, the measure used and the age structure. With the same data, changing any one of these three changes the story the figures tell.
Q1. Why Was 2002 the Largest Postwar Peak?
Commentators point to several overlapping social changes behind the rise in divorce from the 1990s. These include women’s rising employment and economic independence, changing views of the family, timing linked to debate over pension splitting for divorcing couples (in force from April 2007), household strain during the long economic slump, and a weakening of the social taboo around divorce.
According to this view, these factors peaked around 2000, forming the postwar high of 289,836 divorces and a rate of 2.30 in 2002. Some observers link the decline from 2003 to the long-run fall in marriages, as people marry later or not at all, and to timing effects around the introduction of pension splitting for divorcing couples.
Q2. Do One in Three Marriages in Japan End in Divorce?
Two figures underlie the expression. One is the ratio of divorces to marriages in a year, about 38.3% in 2024. The other is the MHLW’s lifetime estimate in a special report of the Vital Statistics, in which divorces divided by marriages come to 0.33 for men and 0.32 for women, close to one-third.
Both point to roughly one-third. In the ratio, however, the denominator and the numerator are different couples, and the lifetime estimate is a hypothetical calculation that adds up age-specific marriage and divorce rates across a whole life. Neither figure simply means that one of every three couples who marry in the same year later divorces.
Q3. Was Japan’s Divorce Rate Higher Before the War?
Yes. Divorce rates in the Meiji era were higher than today. The rate in 1883 is recorded at 3.39 per thousand population, well above the postwar peak of 2.30 in 2002. Divorce before the Meiji-era Civil Code took effect is often described as comparatively easy under the customs of the time.
After the Civil Code took effect, the rate fell, and before the war it generally stayed between about 0.7 and 1.0. The postwar low of 0.73 in 1963 is close to that prewar range. Over the long view, the postwar rise can also be read as a return after a fall from the high Meiji-era levels. The MHLW’s Statistics on Divorce carries the very long series.
🔍 About the Fact-Check for This Article
Japan in Data fact-checks its articles. The evidence for the fact-check of this page is listed below.