
Dividing the alcohol sales volume compiled by the National Tax Agency by the population aged 20 and over gives a per-person figure that can be compared across years. Drawing one bar for each fiscal year from 1991 lays out 34 years of movement in a single view.
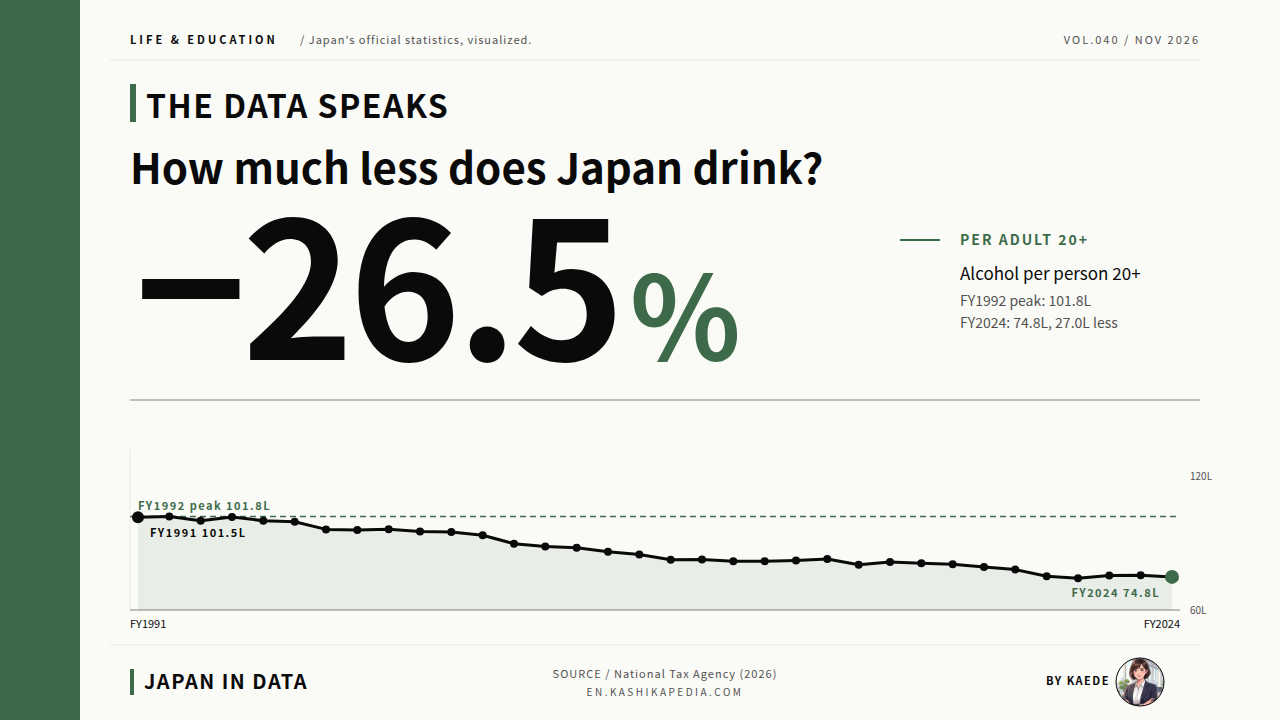
How much less alcohol do people in Japan drink than they used to? According to the National Tax Agency, annual alcohol consumption per person aged 20 and over peaked at 101.8 liters in FY1992 (April 1992 to March 1993) and stood at 74.8 liters in FY2024. The gap is 27.0 liters, a decline of 26.5% over 32 years.
Converted into 350 mL cans, the 27.0-liter decline equals about 77 cans a year. The FY2024 figure of 74.8 liters equals about 214 cans, or roughly four cans a week. The conversion counts every liter of beer or whisky alike as one liter of drink, so it is a count of volume, not of pure alcohol.
The National Tax Agency compiles the figure for each fiscal year by adding the volume that liquor manufacturers and wholesalers sell to consumers to the volume sold by retailers. The total is divided by everyone aged 20 and over, so people who do not drink are included in the average. Okinawa Prefecture is not covered.
This article sets out the data in four charts: consumption per person by fiscal year, national sales volume against the adult population, the shift between drink categories since 1970, and the share of regular drinkers by age group in a national survey by the Ministry of Health, Labour and Welfare.
Japan’s legal drinking age is 20, and the National Tax Agency reports alcohol consumption per person aged 20 and over. Its figure is the volume of alcoholic drinks sold to consumers by manufacturers, wholesalers and retailers, divided by that population. It counts liters of drinks, not pure alcohol, and includes non-drinkers in the average. Okinawa Prefecture is excluded. Figures follow Japan’s fiscal year, which runs from April to the following March. Drinking-habit data come from a Ministry of Health, Labour and Welfare survey.
How much less alcohol do people in Japan drink?
Alcohol consumption per person aged 20 and over is down 26.5% in the 32 years since its FY1992 peak.
Note: compiled and edited by the Japan in Data editorial team from official data.
Figures are current as of the time of writing. Statistics, rules and services are subject to change, so please check the official sources for the latest information.
- Per-Person Alcohol Consumption: From 101.8 Liters in FY1992 to 74.8 Liters
- National Sales Volume and Population: Volume Peaked at 9.66 Million kL in FY1996
- What Fell and What Rose: Beer Down to One-Third of Its FY1994 Level
- Are Young People Drinking Less? Regular Drinking Among Men in Their 20s Fell from 20.2% to 5.0%
- Kaede’s Summary: What 30 Years of Alcohol Consumption Data Show
- Frequently Asked Questions
- 🔍 About the Fact-Check for This Article
Per-Person Alcohol Consumption: From 101.8 Liters in FY1992 to 74.8 Liters
Here, consumption per person aged 20 and over is drawn as one bar per fiscal year from FY1991 to FY2024. The red dashed line marks when the Basic Act on Measures against Alcohol-related Health Harm came into force.
* Compiled and edited by the Japan in Data editorial team based on official government statistics.
Alcohol consumption per person aged 20 and over (FY1991 to FY2024)
| Fiscal year | Per person (L) | Sales volume (10,000 kL) | Population 20+ (10,000 people) |
|---|---|---|---|
| FY1991 | 101.5 | 928 | 9,141 |
| FY1992 | 101.8 | 943 | 9,262 |
| FY1993 | 100.0 | 938 | 9,380 |
| FY1994 | 101.6 | 964 | 9,488 |
| FY1995 | 100.0 | 960 | 9,608 |
| FY1996 | 99.5 | 966 | 9,703 |
| FY1997 | 96.1 | 941 | 9,787 |
| FY1998 | 95.8 | 946 | 9,868 |
| FY1999 | 96.2 | 955 | 9,934 |
| FY2000 | 95.2 | 952 | 9,996 |
| FY2001 | 94.9 | 956 | 10,069 |
| FY2002 | 93.5 | 946 | 10,116 |
| FY2003 | 89.7 | 912 | 10,172 |
| FY2004 | 88.5 | 904 | 10,218 |
| FY2005 | 87.9 | 901 | 10,257 |
| FY2006 | 86.1 | 886 | 10,288 |
| FY2007 | 84.9 | 876 | 10,316 |
| FY2008 | 82.5 | 852 | 10,331 |
| FY2009 | 82.6 | 854 | 10,336 |
| FY2010 | 81.8 | 851 | 10,406 |
| FY2011 | 81.8 | 850 | 10,395 |
| FY2012 | 82.2 | 854 | 10,384 |
| FY2013 | 82.8 | 859 | 10,378 |
| FY2014 | 80.3 | 833 | 10,375 |
| FY2015 | 81.5 | 848 | 10,399 |
| FY2016 | 80.9 | 841 | 10,400 |
| FY2017 | 80.5 | 837 | 10,400 |
| FY2018 | 79.3 | 825 | 10,400 |
| FY2019 | 78.1 | 813 | 10,401 |
| FY2020 | 75.1 | 783 | 10,426 |
| FY2021 | 74.2 | 772 | 10,399 |
| FY2022 | 75.4 | 783 | 10,378 |
| FY2023 | 75.6 | 782 | 10,353 |
| FY2024 | 74.8 | 773 | 10,336 |
* Compiled and edited by the Japan in Data editorial team based on official government statistics.
From FY1991 to FY1996, consumption per person aged 20 and over held at around 100 liters, with a peak of 101.8 liters in FY1992. After it fell to 96.1 liters in FY1997, most years came in below the previous year, reaching 89.7 liters in FY2003 and 82.5 liters in FY2008.
For the ten years from FY2008 to FY2017, the figure stayed almost flat, between 80 and 83 liters. It then fell to 79.3 liters in FY2018, 78.1 liters in FY2019 and 75.1 liters in FY2020. The FY2021 figure of 74.2 liters is the lowest since FY1991. The figure was 75.4 liters in FY2022, 75.6 liters in FY2023 and 74.8 liters in FY2024.
The annual values are editorial calculations: the National Tax Agency’s sales (consumption) volume divided by the population aged 20 and over in the Population Estimates of the Ministry of Internal Affairs and Communications. Of the 14 fiscal years for which the agency publishes its own per-person figures, in the Liquor Handbook and elsewhere, 12 match to one decimal place.
FY2020 and FY2021 differ by 0.1 liters from the values published at the time, which were 75.0 and 74.3 liters. The red dashed line in the chart marks June 2014, when the Basic Act on Measures against Alcohol-related Health Harm came into force.
National Sales Volume and Population: Volume Peaked at 9.66 Million kL in FY1996
With FY1992 set at 100, this chart puts national sales volume next to the population aged 20 and over. The green line is sales volume, and the red line is the population aged 20 and over.
* Compiled and edited by the Japan in Data editorial team based on official government statistics.
National sales (consumption) volume peaked at 9.66 million kL in FY1996, four years after per-person consumption peaked in FY1992. In FY2024 it was 7.73 million kL, 19.9% below the FY1996 level. In FY1970 the volume was 4.90 million kL, and the FY2024 total is 1.58 times that figure.
Between 1992 and 2024, the population aged 20 and over (excluding Okinawa) grew 11.6%, from 92.62 million to 103.36 million. Over the same period, sales volume fell 18.0%, from 9.43 million kL to 7.73 million kL. Total sales volume fell while the population aged 20 and over grew. As the per-person figure divides volume by population, its decline of 26.5% is larger than the decline in volume itself.
The population aged 20 and over peaked in 2020 and has declined gradually since then. In the table above, the figure for each year after 2020 is lower than the year before, through 2024. Over the five fiscal years from FY2020 to FY2024, consumption per person stayed between 74.2 and 75.6 liters.
What Fell and What Rose: Beer Down to One-Third of Its FY1994 Level
This chart stacks sales volume from FY1970 by drink category, such as beer and sake. Beer is the dark green layer at the bottom. The two red dashed lines mark revisions of the Liquor Tax Act.
* Compiled and edited by the Japan in Data editorial team based on official government statistics.
Sales (consumption) volume by category (FY2014 and FY2024)
| Category | FY2014 (10,000 kL) | FY2024 (10,000 kL) | Change | FY2024 per person (L) |
|---|---|---|---|---|
| Sake (seishu) | 55.7 | 38.0 | -31.8% | 3.7 |
| Synthetic sake | 3.4 | 1.7 | -49.7% | 0.2 |
| Shochu, continuous distillation | 40.0 | 29.3 | -26.8% | 2.8 |
| Shochu, single distillation | 46.2 | 34.6 | -25.1% | 3.4 |
| Mirin | 10.1 | 9.1 | -10.4% | 0.9 |
| Beer | 259.6 | 233.0 | -10.2% | 22.5 |
| Fruit wine | 35.1 | 32.7 | -6.7% | 3.2 |
| Sweet fruit wine | 1.0 | 1.0 | -1.4% | 0.1 |
| Whisky | 11.8 | 20.5 | +73.6% | 2.0 |
| Brandy | 0.7 | 0.4 | -34.8% | 0.0 |
| Happoshu | 76.5 | 97.7 | +27.7% | 9.4 |
| Liqueurs | 197.9 | 165.5 | -16.4% | 16.0 |
| Spirits, etc. | 31.9 | 92.5 | +190.0% | 8.9 |
| Other brewed liquors, etc. | 63.2 | 17.3 | -72.7% | 1.7 |
| Total | 833.1 | 773.2 | -7.2% | 74.8 |
* Compiled and edited by the Japan in Data editorial team based on official government statistics.
By category, beer shows the largest movement. Beer sales peaked at 7.06 million kL in FY1994, when beer made up 73.2% of all alcoholic drinks sold. In FY2024 beer sales were 2.33 million kL, a share of 30.1%. Beer sales have fallen 67.0% from their FY1994 peak, to about one-third of that level.
Sake (nihonshu, brewed from rice) peaked at 1.67 million kL in FY1975 and was down 77.3% at 380,000 kL in FY2024. Meanwhile, happoshu, a beer-like drink with less malt, grew from the late 1990s, and liqueurs, a tax category that includes chu-hi, grew from the 2000s. Happoshu peaked in FY2002 and liqueurs in FY2020, at 2.56 million kL.
The table above compares FY2014 with FY2024. Whisky rose 1.74 times, from 118,000 kL to 205,000 kL, and spirits and similar categories rose 2.90 times, from 319,000 kL to 925,000 kL. While total volume fell over the decade, whisky and spirits both stand higher than they did ten years earlier.
In its Liquor Report (July 2026), the National Tax Agency states that the fall in taxable beer volume is thought to be due in part to a shift in consumption from beer to lower-priced happoshu (including so-called “new genre” drinks) and to liqueurs such as chu-hi. The two dashed lines in the chart mark the April 1989 revision, which abolished the grade system among other changes, and the October 2023 revision of category definitions.
Category definitions were revised in FY2006 and in October 2023. Since October 2023, more volume has been counted as happoshu, and less as liqueurs and as other brewed liquors. Category volumes from before and after these changes are not directly comparable.
Are Young People Drinking Less? Regular Drinking Among Men in Their 20s Fell from 20.2% to 5.0%
This chart compares, by age group, the share of men who drink at least three days a week and at least one gō on each drinking day, in 2003 and in 2024. The pale green dots are 2003, and the dark green dots are 2024.
* Compiled and edited by the Japan in Data editorial team based on official government statistics.
Share of people with a regular drinking habit, by sex and age
| Age | Men 2003 | Men 2019 | Men 2024 | Women 2003 | Women 2019 | Women 2024 |
|---|---|---|---|---|---|---|
| 20 and over | 37.4% | 33.9% | 30.3% | 6.6% | 8.8% | 8.7% |
| 20s | 20.2% | 12.7% | 5.0% | 7.0% | 3.1% | 3.7% |
| 30s | 35.6% | 24.4% | 19.0% | 11.3% | 11.1% | 9.7% |
| 40s | 48.5% | 38.3% | 31.0% | 12.6% | 13.2% | 11.1% |
| 50s | 50.0% | 41.4% | 38.5% | 6.6% | 16.6% | 18.0% |
| 60s | 41.0% | 46.6% | 44.9% | 3.8% | 8.4% | 9.9% |
| 70 and over | 24.0% | 27.3% | 27.4% | 1.3% | 3.5% | 3.5% |
* Compiled and edited by the Japan in Data editorial team based on official government statistics.
This section turns to a separate survey that shows which age groups drink, and how often. The Ministry of Health, Labour and Welfare’s National Health and Nutrition Survey counts as regular drinkers those who say they drink at least three days a week and at least one gō (a traditional sake measure) on each drinking day. Among men aged 20 and over, this share fell from 37.4% in 2003 to 30.3% in 2024.
By age group, between 2003 and 2024 the share fell from 20.2% to 5.0% for men in their 20s, from 35.6% to 19.0% for men in their 30s, from 48.5% to 31.0% for men in their 40s, and from 50.0% to 38.5% for men in their 50s. Each of these four groups fell by more than 10 percentage points.
Among men in their 60s, by contrast, the share rose from 41.0% to 44.9%, and among men aged 70 and over it rose from 24.0% to 27.4%. Young people are often described as turning away from alcohol. The decline is not limited to men in their 20s, however: men in their 30s to 50s show the same direction.
Women show a different pattern. Among all women aged 20 and over, the share rose from 6.6% to 8.7%. It fell from 7.0% to 3.7% for women in their 20s, but rose from 6.6% to 18.0% for women in their 50s and from 3.8% to 9.9% for women in their 60s. For women in their 30s it went from 11.3% to 9.7%, and for those in their 40s from 12.6% to 11.1%.
The 2024 figures are the values the survey report presents as nationally adjusted, and they are compiled differently from figures for 2019 and earlier. Respondents in their 20s are few (619 men in their 20s in 2024), and results for this group vary widely from year to year. The survey is also self-reported, and it differs in timing and coverage from the National Tax Agency’s sales volume.
Kaede’s Summary: What 30 Years of Alcohol Consumption Data Show
Set side by side, the four charts show what lies inside the decline: the amount per person, national volume and population, drink categories, and age groups. Here they are organized into three observations.
The question was how much less people in Japan drink. The charts in this article show that consumption per person has fallen since its FY1992 peak, and that the make-up of that decline differs by drink category and by age group. What follows sets out the movements so far as observations, not as reasons or forecasts.
Over 32 years in which the population aged 20 and over grew, alcohol consumption per person fell to about three-quarters of its peak. Within that total, beer volume fell to about one-third, and the share of regular drinkers fell among men in their 20s to 50s. These are the patterns the three observations share.
Frequently Asked Questions
When reading these statistics, keep two points in mind: the figures measure the volume of drinks, not pure alcohol, and they are averages across everyone aged 20 and over.
Q1. How Much Alcohol Does a Person in Japan Drink in a Year?
According to National Tax Agency statistics, alcohol consumption per person aged 20 and over was 74.8 liters in FY2024. In 350 mL cans, that is about 214 cans a year. The figure counts every liter of beer or whisky alike as one liter of drink, not pure alcohol. It is an average over everyone aged 20 and over, including non-drinkers, and it excludes Okinawa.
Q2. When Was Alcohol Consumption Highest?
Per person aged 20 and over, the peak was 101.8 liters in FY1992. For national sales (consumption) volume, the peak was 9.66 million kL in FY1996. In FY2024 the per-person figure was 74.8 liters and the national volume was 7.73 million kL, 26.5% and 19.9% below their respective peaks.
Q3. Are Young People in Japan Drinking Less?
In the Ministry of Health, Labour and Welfare’s National Health and Nutrition Survey, the share with a regular drinking habit (at least three days a week and at least 1 gō a day) fell from 20.2% in 2003 to 5.0% in 2024 for men in their 20s, and from 7.0% to 3.7% for women in their 20s. The 2024 figures are nationally adjusted values, and the 20s sample is small and varies widely from year to year, so the figures are presented here as a comparison of two points in time.
🔍 About the Fact-Check for This Article
Japan in Data fact-checks its articles. The evidence for the fact-check of this page is set out below.