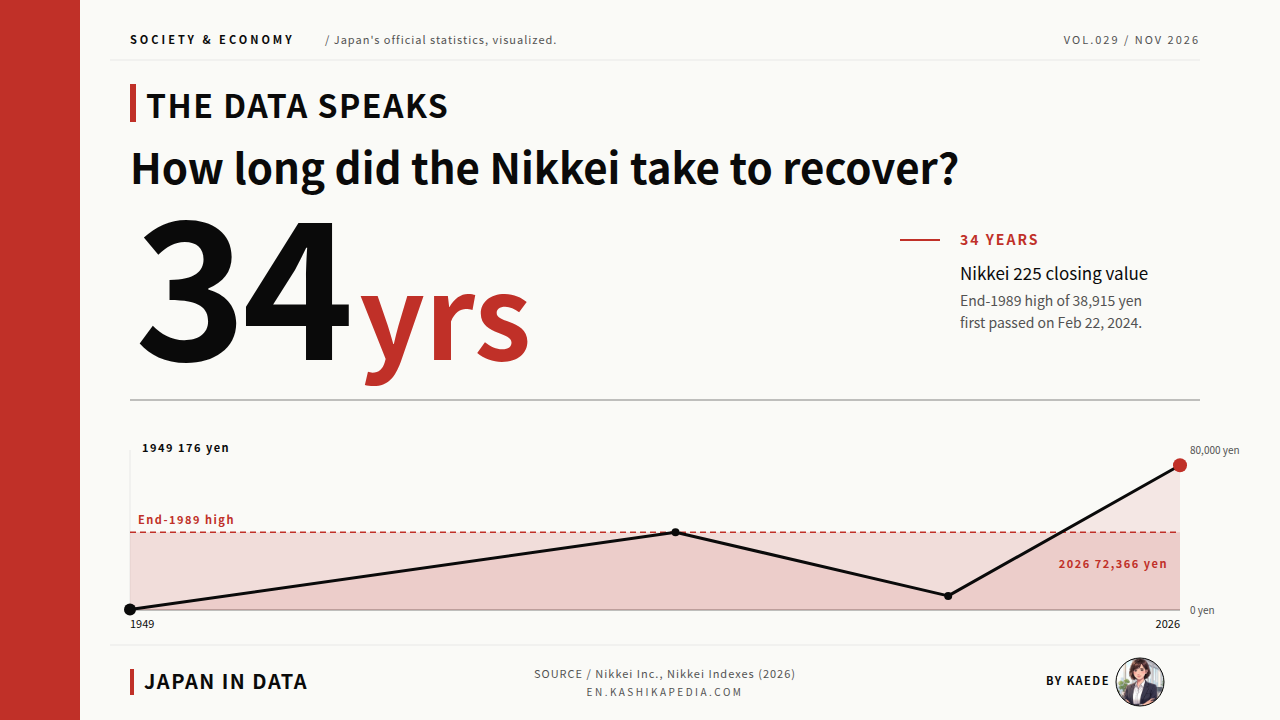

The long history of the Nikkei Stock Average is easiest to read as a single line of year-end closing values, with a horizontal line drawn at the end-1989 level. One chart then shows both how long the line stayed below that level and how it climbed after crossing it.
On February 22, 2024, the Nikkei Stock Average closed at ¥39,098.68, above the ¥38,915.87 close of December 29, 1989, for the first time. The 1989 figure is often described as the bubble-era high. It took 34 years, or 12,473 days, for a closing value to pass the end-1989 record. That span equals the time a person born in December 1989 needed to reach age 34.
The closing value then reached an all-time high of ¥72,366.34 on June 25, 2026, and stood at ¥64,075.42 at the close on October 20, 2026. Using closing values published by Nikkei Inc. on its Nikkei Indexes website, this article sets out the series from its base date of May 16, 1949 to October 2026 in six charts. It does not cover trading decisions or the outlook for the market.
The Nikkei Stock Average, usually called the Nikkei 225, is a stock index calculated by Nikkei Inc., the publisher of the Nihon Keizai Shimbun newspaper. It is based on the share prices of 225 leading companies listed on the Tokyo Stock Exchange. The index is quoted in yen and sen (hundredths of a yen). Unless stated otherwise, figures in this article are closing values, the level at the end of each trading day, and years are calendar years. The 2026 figures run to October 20, 2026.
How long did the Nikkei take to pass its end-1989 high?
It first closed above ¥38,915 on February 22, 2024, after 34 years.
Source: Nikkei Inc., Nikkei Indexes Historical Data, closing values (2026)
* Compiled and edited by the Japan in Data editorial team based on official government statistics.
Information in this article is current as of the time of writing. Figures, rules and services are subject to change, so please check each official website for the latest information.
- What Is the Nikkei Stock Average? 225 Stocks Since May 16, 1949
- Year-End Closes, 1949 to 2026: 77 Years on Two Scales
- 34 Years Below the End-1989 High: The Low Came on March 10, 2009
- First Closes Above Each Round Number: ¥10,000 to ¥70,000
- Year-by-Year and Day-by-Day Records of Price Moves
- Kaede’s Summary: Three Observed Facts From 77 Years of Nikkei Closes
- Frequently Asked Questions
- 🔍 About the Fact-Check for This Article
What Is the Nikkei Stock Average? 225 Stocks Since May 16, 1949
Before reading the values, it helps to check when the Nikkei Stock Average began and how it is calculated. The base date and the changes to its name show where the 77-year line starts.
The Nikkei Stock Average is a stock index calculated by Nikkei Inc. from the share prices of 225 leading companies listed on the Tokyo Stock Exchange. According to Nikkei Indexes, it is not a simple sum of 225 prices divided by 225. Adjustments are made so that changes to the constituent list and stock splits do not cause jumps, keeping the series continuous. Values are published in yen and sen.
The base date is May 16, 1949, when trading resumed on the Tokyo Stock Exchange after the Second World War, and the value that day was ¥176.21. Calculation actually began on September 7, 1950, with values computed back to the base date. The Tokyo Stock Exchange first compiled the index. Its name changed from the TSE Stock Price Average to the NSB 225 Adjusted Average and the Nikkei Dow Average, and it has been called the Nikkei Stock Average since 1985.
Year-End Closes, 1949 to 2026: 77 Years on Two Scales
The 77 years of year-end closes are shown first as an ordinary line chart for the overall shape, then again on a scale where each step is a tenfold change. Seen in sequence, the two charts show how the same data takes a different shape depending on the scale.
* Compiled and edited by the Japan in Data editorial team based on official government statistics.
Year-end closes rose from ¥109 and 91 sen at the end of 1949 to ¥38,915.87 at the end of 1989, with rises and falls along the way. Against the horizontal line at the end-1989 level, every year-end close from 1990 to 2023 sits below the line. The first year-end close above it came in 2024, at ¥39,894.54.
From 2024 the slope of the line changes. The year-end close for 2025 was ¥50,339.48. In 2026 the index set an all-time closing high of ¥72,366.34 on June 25 and closed at ¥64,075.42 on October 20. At the index level, the all-time high is about 1.86 times the end-1989 high and about 411 times the base value of May 16, 1949. These multiples compare index levels only and do not represent investment returns including dividends.
* Compiled and edited by the Japan in Data editorial team based on official government statistics.
Drawn on a scale where each step is a tenfold change, the same year-end closes from the 1950s to the 1980s appear to rise at a nearly constant slope. On this scale equal heights represent equal ratios, so the moves from ¥100 to ¥1,000 and from ¥1,000 to ¥10,000 take up the same space. The end-1989 close was about 354 times the end-1949 close, and the end-2025 close about 458 times.
34 Years Below the End-1989 High: The Low Came on March 10, 2009
With the end of 1989 set at 100, the line for these 34 years shows at a glance how far the index fell and when it returned to 100. Follow the distance between the line and the horizontal line at 100.
* Compiled and edited by the Japan in Data editorial team based on official government statistics.
With the end of 1989 set at 100, the year-end close stood at 61.3 at the end of 1990 and 43.5 at the end of 1992. Readings below 100 continued, and the lowest was 21.7 at the end of 2011. In those 34 years no year-end close exceeded the end-1989 level, and the first reading above 100 was 102.5 at the end of 2024.
On a daily closing basis, the low for this period was ¥7,054.98 on March 10, 2009. That was 81.9% below the ¥38,915.87 close of December 29, 1989, leaving the index at a little under one-fifth of its high. The high was finally surpassed on February 22, 2024, with a close of ¥39,098.68, 34 years and 12,473 days after December 29, 1989.
Over these 34 years, Japan’s official business-cycle records list several peaks and troughs. This article sets out only the values and dates of the stock index. It does not examine how the index relates to the business cycle, gross domestic product or other economic indicators, and the figures here are not presented as a measure of the wider economy.
First Closes Above Each Round Number: ¥10,000 to ¥70,000
The first close above each ¥10,000 level is listed below, with a horizontal bar for the number of days since the previous level. The difference in bar length is the difference in the time each level took to reach.
* Compiled and edited by the Japan in Data editorial team based on official government statistics.
The index first closed above ¥10,000 on January 9, 1984, above ¥20,000 on January 30, 1987, and above ¥30,000 on December 7, 1988. The step from ¥10,000 to ¥20,000 took 1,117 days, and the step from ¥20,000 to ¥30,000 took 677 days. The step from ¥30,000 to ¥40,000 took 12,871 days, with the first close above ¥40,000 on March 4, 2024.
The intervals shorten after 2024. The first closes above ¥50,000, ¥60,000 and ¥70,000 came on October 27, 2025, April 27, 2026 and June 18, 2026, and the three steps took 602, 182 and 52 days. Each date here is the first day the close exceeded that level. The ¥60,000 mark, for example, had already been passed during trading on April 23, 2026.
Year-by-Year and Day-by-Day Records of Price Moves
Annual changes against the previous year-end are shown as vertical bars, and the largest one-day moves as horizontal bars. Compare the number and length of the upward and downward bars.
* Compiled and edited by the Japan in Data editorial team based on official government statistics.
Over the 76 years from 1950 to 2025, the year-end close was above the previous year-end in 50 years and below it in 26. The largest annual change was +118.4% in 1952, and the smallest was -42.1% in 2008, followed by -38.7% in 1990. Years with a rise on the previous year-end make up about two-thirds of the 76.
* Compiled and edited by the Japan in Data editorial team based on official government statistics.
In the records for one-day percentage changes, the largest fall is 14.90% on October 20, 1987, and the second largest is 12.40% on August 5, 2024. The largest rise is 14.15% on October 14, 2008, followed by 13.24% on October 2, 1990. The largest fall in yen terms also came on August 5, 2024, at ¥4,451.28, and the largest gain in yen terms was ¥3,320.72 on May 7, 2026.
Kaede’s Summary: Three Observed Facts From 77 Years of Nikkei Closes
Year-end closes, the ratio to end-1989, the gaps between round numbers and the record moves show the same 77-year index from four angles. They can be organized into three observed facts.
The charts in this article look again at one series, the closing values of the Nikkei Stock Average, using different scales and reference points. Without attaching any evaluation to the size of the numbers, the recorded values and dates are set out below as observed facts.
Set side by side, the three facts show the 34 years below the end-1989 high and the 2 years and 4 months that took the index into the ¥70,000 range within the same series. The Nikkei Stock Average close is updated every trading day, so the 2026 values are as of October 20 and are subject to change before the end of the year.
Frequently Asked Questions
When reading Nikkei Stock Average records, check two points: whether a figure is a closing value or an intraday value, and the date it refers to. A figure described as a record high can point to different numbers depending on which is meant.
Q1. How Is the Nikkei Stock Average Calculated?
Nikkei Inc. calculates it from the share prices of 225 leading companies listed on the Tokyo Stock Exchange. It is not a simple average: adjustments remove the effect of constituent changes and stock splits so that the index stays continuous. The base value is ¥176.21 on May 16, 1949, when trading resumed on the Tokyo Stock Exchange after the war, and calculation began on September 7, 1950. The current name dates from 1985.
Q2. Why Do Record-High Figures Differ Between Sources?
There are two kinds of value: the close, set at the end of the trading day, and values reached during trading hours. This article uses closing values throughout. For 1989 that is the close of ¥38,915.87 on December 29 (the intraday high was ¥38,957.44), and for 2026 the close of ¥72,366.34 on June 25. The intraday record is ¥72,831.73, set on June 22, 2026.
Q3. How Were the 1949 and 1950 Values Produced?
Calculation of the Nikkei Stock Average began on September 7, 1950. Earlier values were computed retroactively back to May 16, 1949, the day trading resumed on the Tokyo Stock Exchange after the war. The base value is ¥176.21, and the lowest close on record is ¥85 and 25 sen on July 6, 1950.
🔍 About the Fact-Check for This Article
Japan in Data fact-checks its articles. The evidence for the fact-check on this page is set out below.