
The quickest way into the “Lost 30 Years” is to set indicators from different angles (average salary, GDP, stock prices and international rankings) side by side across 35 years. Any single indicator gives its own impression, so this article bundles five of them to observe the overall outline.
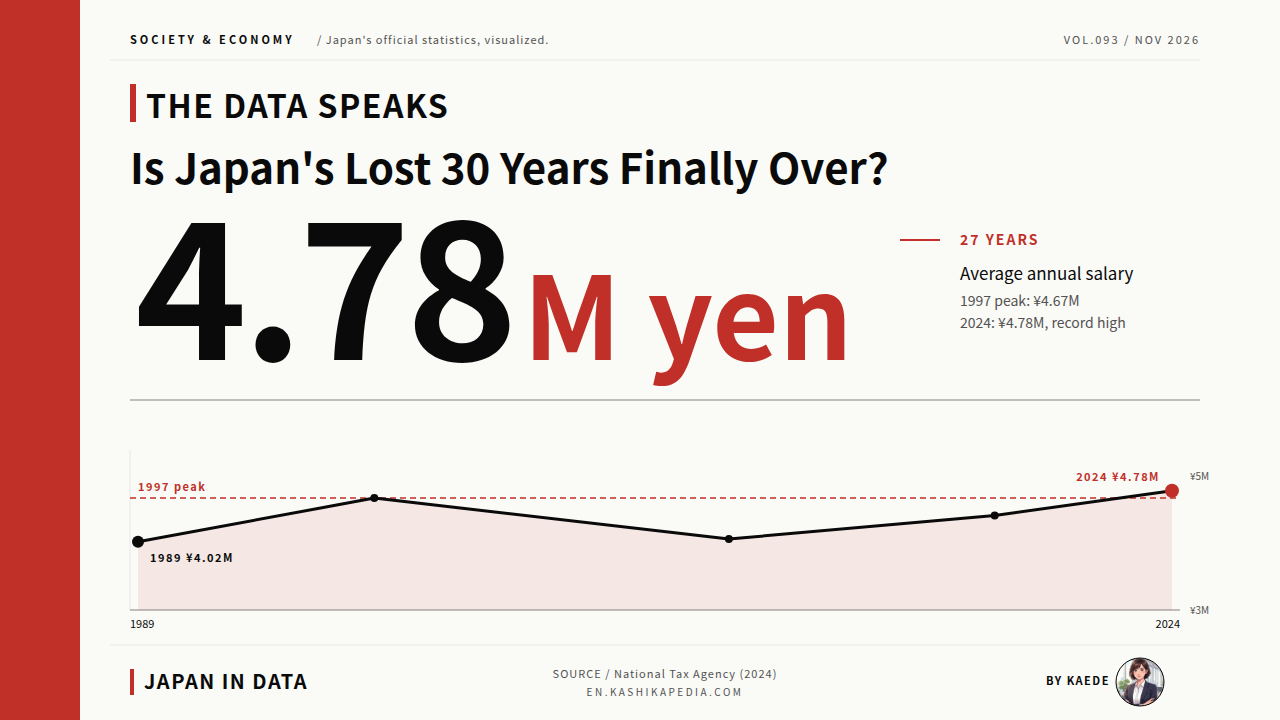
The phrase “Lost 30 Years” has long been used to describe Japan’s economy, and since 2024 its outline has begun to change. National Tax Agency data put the 2024 average salary at ¥4.78 million, above the 1997 peak of ¥4.67 million for the first time in 27 years. The Nikkei Stock Average set a record in February 2024 and reached the ¥60,000 level in April 2026. Yet GDP per capita in dollars ranked 22nd of 38 OECD members in 2023. A recovery in yen terms and a decline in international comparisons are taking place at the same time.
This article draws on primary sources: the IMF World Economic Outlook (April 2026), the National Tax Agency’s Statistical Survey of Actual Status for Salary in the Private Sector (2024 final figures), OECD Average annual wages and the Nikkei Stock Average profile. Five charts cover average salary, nominal and real GDP, an OECD wage comparison, the Nikkei Stock Average and GDP per capita rank, tracing the 37 years from the 1989 bubble peak to 2026.
The Lost 30 Years (ushinawareta 30-nen) is a widely used Japanese label for the long period of slow economic growth that followed the bursting of the asset price bubble around 1991. Nominal figures are in current yen and include price changes; real figures remove the effect of price changes. Average salary here comes from the National Tax Agency’s annual survey of private-sector pay. Purchasing power parity (PPP) adjusts international comparisons for differences in price levels. The Nikkei Stock Average is a leading index of major shares listed on the Tokyo Stock Exchange.
What changed in Japan over the Lost 30 Years?
Average salary passed its old peak after 27 years, while Japan slipped in dollar-based international comparisons.
Information is current as of the time of writing. Figures, rules and services may change, so please check each official website for the latest information.
- What Was the Lost 30 Years? The Outline of Stagnation in Numbers
- Average Salary Took 27 Years to Pass Its 1997 Level
- International Comparisons Show Japan’s Wages Alone Stayed Flat
- Stock Prices Hit a Record After 34 Years and Reach ¥60,000
- GDP per Capita: Japan’s Slide in the World Rankings
- Kaede’s Summary: What the Lost 30 Years Shows in Five Charts
- Frequently Asked Questions
- 🔍 About the Fact-Check for This Article
What Was the Lost 30 Years? The Outline of Stagnation in Numbers
For a first view of the Lost 30 Years, two lines work well: nominal GDP and real GDP. Nominal figures include price changes and real figures do not, so placing them side by side shows where the stagnation of the late 1990s and 2000s sits.
* Compiled and edited by the Japan in Data editorial team based on official government statistics.
The term “Lost 30 Years” has been used for the economic stagnation that followed the collapse of the bubble in 1991. In nominal terms, GDP grew from ¥471.8 trillion in 1990 to ¥554.1 trillion in 1997, an average of 2.3% a year. After the 1997 peak it turned down, falling to ¥499.4 trillion in 2009, after the Lehman shock. A 12-year decline in nominal GDP, from 1997 to 2009, is often described as unique to Japan among major postwar advanced economies. Real GDP, by contrast, kept rising slowly while prices fell.
Nominal GDP turned up from its 2009 low and reached ¥663.8 trillion in 2025, about 41% above 1990 and the highest level since the war. The rise overlapped with Abenomics (the economic program of 2013 to 2020, with large-scale monetary easing), a weaker yen and rising prices from 2022, and the export recovery after COVID-19. Real GDP in 2025 was ¥591.4 trillion, 33% above 1990. Some economists note that real growth stayed below that of the United States, South Korea and Taiwan, and describe the period as “30 years without growth.”
There are several views on where the Lost 30 Years begins: 1991, when the bubble burst; 1989, when stock prices peaked; or 1995, when wages and GDP peaked. This article treats “30 years” as an approximate span. For each indicator it states how many years have passed since the peak, and it reads the economy through five measures taken from different angles.
Average Salary Took 27 Years to Pass Its 1997 Level
Drawing 35 years of average salary as one line, from the 1997 peak down to the 2009 low and through the long recovery afterward, makes the length of both the stagnation and the recovery easy to see.
* Compiled and edited by the Japan in Data editorial team based on official government statistics.
According to the National Tax Agency’s survey, average salary rose steadily from ¥4.02 million in 1989 to ¥4.67 million in 1997, about 2% a year on average. After 1997, a year that saw the consumption tax raised to 5% and was followed by the Asian financial crisis and a domestic banking crisis, average salary entered a decline. By 2009, just after the Lehman shock, it had fallen to ¥4.06 million, ¥610,000 or about 13% below the 1997 peak.
Average salary began rising again in the late 2010s, reaching ¥4.41 million in 2018 and ¥4.78 million in 2024, the highest on record. Passing the 1997 peak of ¥4.67 million took 27 years. The gain over 1997 is 2.4%, while consumer prices in 2025 were 11.9% above 2020. Many economic research institutions assess that real wages, adjusted for prices, have not yet returned to their 1997 level. In nominal terms the old peak has been passed; in real purchasing power, according to those assessments, it has not.
Gaps by gender and by employment type are also part of the picture. National Tax Agency data show 2024 average salary of about ¥5.89 million for regular employees and about ¥2.11 million for non-regular employees, a gap of about 2.8 times. The non-regular share rose from about 20% in 1990 to about 37% in 2024, and some analysts link this shift to the lower overall average. The level of pay and the changing mix of employment are separate layers of data.
International Comparisons Show Japan’s Wages Alone Stayed Flat
For international comparisons that remove currency and price effects, the standard approach is a PPP-adjusted index with 1990 set at 100. With Japan, the United States and South Korea on one chart for 32 years, the difference in growth shows up as the slope of each line.
* Compiled and edited by the Japan in Data editorial team based on official government statistics.
The OECD’s Average annual wages data, in 2022 US dollars at purchasing power parity, allow wages to be compared over time after adjusting for prices. With 1990 set at 100, the United States stood at about 153 in 2022, South Korea at about 194 and Japan at about 106. Over the same 32 years, wages grew 1.5 times in the United States and about 2 times in South Korea, against 1.06 times in Japan, close to flat. Among OECD members as a whole, Japan’s growth rate is in the lowest group.
In absolute terms, Japan’s OECD average wage was US$37,370 in 1990 and US$39,711 in 2021. The US figure rose from about US$48,800 in 1990 to US$74,738 in 2021. South Korea, after rapid growth from the late 1990s, passed Japan in the 2010s and now stands in the US$42,000 range. In the OECD ranking, Japan moved from 11th in 1990 to 24th of 34 countries in 2021 and 25th in 2022, a drop of 14 places over about 30 years.
Observers have pointed to several factors behind the slower wage growth: a habit of holding prices steady during deflation, rising corporate retained earnings and a lower share of income paid out as wages, a flatter seniority pay curve under lifetime employment, wider use of non-regular work, and slow productivity gains. The figures do not single out one cause, and wages remain one of the central indicators in discussions of the Lost 30 Years.
Stock Prices Hit a Record After 34 Years and Reach ¥60,000
Across 37 years of stock prices, four milestones stand out: the 1989 high, the post-Lehman low of 2009, the 2024 record after 34 years and the ¥60,000 level of 2026. Joined by a line, they show at a glance what happened in the late stage of the Lost 30 Years.
* Compiled and edited by the Japan in Data editorial team based on official government statistics.
On December 29, 1989, the Nikkei Stock Average closed at ¥38,915.87, a level with few precedents anywhere at the time. By the end of the following year it had fallen to ¥23,848, down 39%, and a long slump followed. In March 2009, amid the global sell-off after the Lehman shock, it fell to ¥7,054, about 82% below the 1989 peak. Over those 20 years, the Japanese stock market lost most of its market value.
The recovery coincided with the Abenomics rally from 2013 and, from 2023, with the Tokyo Stock Exchange’s corporate governance reforms and renewed interest from overseas investors. On February 22, 2024, the index closed at ¥39,098.68, its first record high in 34 years and 2 months. It first closed above ¥40,000 on March 4 that year, passed ¥50,000 on October 27, 2025, and reached the ¥60,000 level on April 23, 2026. After 34 years to regain its old high, the index rose more than 50% in just over 2 years.
Commentators cite several factors: a weaker yen lifting exporters’ earnings, higher dividends and share buybacks under the governance reforms, steady buying by overseas investors, and larger allocations to Japanese equities by domestic pension funds, including the Government Pension Investment Fund (GPIF). There is a long time lag between rising share prices and rising average pay, and some observers note that the stock market boom has not yet spread widely to household finances.
GDP per Capita: Japan’s Slide in the World Rankings
Ranks read most naturally as a line with first place at the top. Laying out the 28 years from 1995 to 2023 on one chart shows the pace of the slide, with a falling rank drawn as a line heading downward.
* Compiled and edited by the Japan in Data editorial team based on official government statistics.
Measured as nominal GDP per capita in US dollars, Japan ranked around 5th in the world in 1995, at US$44,210, in the top group alongside the G7, the Nordic countries and Switzerland. It then ranked 18th in the OECD in 2000, 21st in 2010 and 22nd of 38 OECD members in 2023, at US$33,849. According to the Cabinet Office’s latest international comparison, Japan has dropped 17 places in 28 years and by 2023 had been passed by Italy and South Korea.
Two factors are usually cited for the decline: exchange rates when converting to dollars, and growth in other economies. The yen weakened from around ¥80 per dollar in 2012 to around ¥150 from 2024, lowering the dollar value. Neighbouring East Asian economies moved ahead one after another: Singapore in 2007, Taiwan in 2022 and South Korea in 2023. Excluding the weaker yen, Japan’s GDP per capita has continued to grow slowly; in dollar-based comparisons, the decline continues.
Labor productivity, measured per hour across OECD members, has stayed low for longer. According to the Japan Productivity Center, Japan ranked between 20th and 22nd from 1998 to 2017 and 32nd of 38 OECD members in 2023, below its GDP per capita rank of 22nd. Some observers link slow wage growth to slow productivity growth, and describe it as one of the hardest structural issues to resolve in the debate over the Lost 30 Years.
Kaede’s Summary: What the Lost 30 Years Shows in Five Charts
Taken together, the five charts show that the period grouped as the Lost 30 Years tells a different story depending on the indicator. Here are three observations.
What stood still in Japan’s economy during the Lost 30 Years, and what moved? The five charts in this article show a layered picture: recovery in yen terms, decline in international comparisons, and short-term and long-term trends running in parallel. Without ranking the data, the differences in how it looks are set out below as observations.
Read together, the three observations do not give a simple yes or no to the question of whether the Lost 30 Years has ended. Recovery in nominal terms, real pay that has not yet returned to its earlier level, and continued decline in international comparisons all hold at the same time. Conclusions about the Lost 30 Years change with the indicator, the period and the currency chosen, and that observation itself describes the present picture most closely.
Frequently Asked Questions
Here are three questions often asked about the Lost 30 Years, answered with where the data stands.
Q1. Has the Lost 30 Years Ended?
The answer depends on the indicator. In nominal yen (average salary, the Nikkei Stock Average and nominal GDP), old peaks were passed one after another between 2024 and 2026. In dollar-based international comparisons, Japan ranked 22nd in the OECD for GDP per capita in 2023 and 32nd for labor productivity. Some analyses find that real wages, adjusted for prices, have not yet returned to their 1997 level. As of April 2026, indicators that suggest an end and indicators that suggest continuation exist side by side.
Q2. Why Did Japan Alone Stall for 30 Years?
Observers point to several factors rather than a single cause. On policy, they cite the slide into deflation after the 1997 consumption tax rise to 5% and the slow exit from it. On employment, they cite a flatter seniority pay curve tied to lifetime employment and the growth of non-regular work, from about 20% in 1990 to about 37% in 2024. On corporate governance, they note rising retained earnings and a lower labor share. Many economic research institutions also cite a shrinking working-age population and slow gains in productivity and digitalization, acting in combination.
Q3. When Did South Korea Pass Japan in GDP per Capita?
According to Cabinet Office international comparison data, South Korea passed Japan in nominal GDP per capita in US dollars in 2023. Italy had already passed Japan by 2022, and in 2023 Japan ranked 22nd of 38 OECD members, with South Korea ranked higher. On a purchasing power parity (PPP) basis, Singapore passed Japan in 2007 and Taiwan in 2022. Exchange rates and growth elsewhere both play a part, and dollar-based rankings move with the value of the yen.
🔍 About the Fact-Check for This Article
Japan in Data fact-checks its articles. The evidence for the fact-check of this page is set out below.