
The question of how much Japan’s foreign resident population has grown takes shape when the latest year sits beside the 70-year trend and the breakdowns by nationality, status of residence and prefecture. Two different “counts of foreigners”, built on different methods, are also sorted out here, starting from their definitions.
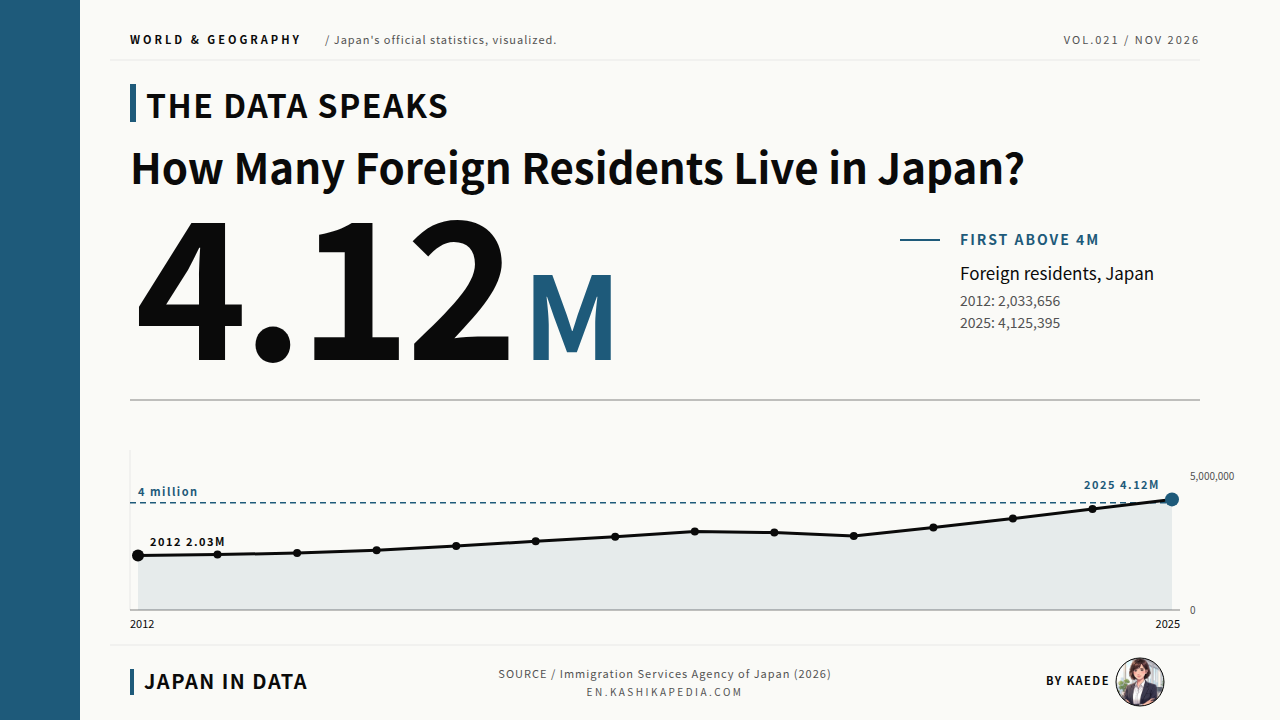
Japan’s foreign resident count, published by the Immigration Services Agency of Japan (ISA), is the number of mid- to long-term residents and special permanent residents at the end of December each year. It excludes short-term visitors such as tourists. On March 27, 2026, the ISA reported 4,125,395 foreign residents at the end of 2025, about 2.0 times the 2,033,656 recorded at the end of 2012, when the current statistics began (our calculation).
According to the ISA, the end-2025 figure is a record high and the first time the total has exceeded 4 million. The rise has not followed a straight line. The count fell year on year at the end of both 2020 and 2021, and since 2022 it has grown by more than 300,000 a year for four straight years. The increase at the end of 2025 was 356,418 (up 9.5%).
This article draws on the ISA’s release for the end of 2025 and other official materials to chart the long-run trend since 1955, the 2012 to 2025 trends by nationality and status of residence, and the distribution across Japan’s 47 prefectures. It also sets out, from the definitions, how the count differs from the foreign population of 3.84 million in the 2025 Population Census, released on September 29, 2026.
Japan’s Immigration Services Agency (ISA) publishes the number of foreign residents twice a year, as of the end of June and the end of December. The figure combines mid- to long-term residents, who hold a residence card, and special permanent residents, a separate status for people who lost Japanese nationality under the Treaty of Peace with Japan and their descendants. Tourists and other short-term visitors are excluded. Prefectures are Japan’s 47 top-level regions. The national census, held every five years, counts foreign nationals on a different basis.
How many foreign nationals live in Japan, and how much has the number grown since the current statistics began in 2012?
4,125,395 at the end of 2025, about 2.0 times the end-2012 level.
Information is current as of the time of writing. Figures, rules and services may change, so please check each official website for the latest information.
- How Has the Count Changed Over 70 Years? A Statistical Break in 2012
- Not a Straight Line: 13 Years of Year-on-Year Change
- By Nationality: China Is Largest, Vietnam Up 13 Times
- By Status of Residence: About 1 in 4 Are Permanent Residents
- By Prefecture: Tokyo Holds 19.4% of the National Total
- Foreign Resident Count vs. Census Foreign Population: How They Differ
- Tables by Year, Nationality and Prefecture
- Kaede’s Summary: A Long Rise That Did Not Follow a Straight Line
- Frequently Asked Questions
- 🔍 About the Fact-Check for This Article
How Has the Count Changed Over 70 Years? A Statistical Break in 2012
Drawing the 70 years with three line styles, one for each counting method, shows how far the figures can be compared on the same scale. The year the statistics were split and the year the Specified Skilled Worker system began are both marked.
* Compiled and edited by the Japan in Data editorial team based on official government statistics.
Under the alien registration system, Japan counted 641,482 registered foreign nationals in 1955. The 1985 figure was 850,612, an increase of about 210,000 over 30 years (our calculation). Values in this period are alien registration counts as such, and they cover a different range of people from today’s foreign resident count.
Figures for 1990 to 2011 were recalculated by the ISA. They count special permanent residents plus those registered foreign nationals whose status of residence could correspond to mid- to long-term residence. The 1990 figure was 1,053,041. The highest value in this period was 2,144,682 in 2008, and the 2011 figure was 2,047,349.
On July 9, 2012, the alien registration system was abolished and a residence management system based on residence cards began. The statistics were redefined to cover mid- to long-term residents and special permanent residents, and the current count starts at the end of 2012. On the current basis, the count rose by 2,091,739 in 13 years, from 2,033,656 at the end of 2012 to 4,125,395 at the end of 2025 (our calculation).
Not a Straight Line: 13 Years of Year-on-Year Change
Lining up each year’s change from the previous year as columns separates, at a glance, the years that fell below the previous year from the years of large increases.
* Compiled and edited by the Japan in Data editorial team based on official government statistics.
Year on year, the count rose by 32,789 in 2013, and the increases widened to 110,358 in 2015 and 202,044 in 2019 (our calculation). The count then fell by 46,021 at the end of 2020 and by 126,481 at the end of 2021, two consecutive annual declines. The end-2021 total was 2,760,635.
The count rose by 314,578 at the end of 2022, then by 335,779 in 2023, 357,985 in 2024 and 356,418 in 2025, exceeding 300,000 for four consecutive years. The 2025 increase was slightly smaller than the 2024 increase, and the growth rate was 9.5%, against 10.5% in 2024.
Set side by side by status of residence, the end-2021 figures were 73,071 lower for Student and 102,077 lower for Technical Intern Training than a year earlier. At the end of 2022, Student stood at 300,638 and Technical Intern Training at 324,940, both above the previous year. The breakdown by status of residence is covered in a later section.
By Nationality: China Is Largest, Vietnam Up 13 Times
Overlaying the lines for the top 8 nationalities and regions shows where each line crossed another. South Korea and “Chosen” are counted separately, as in the ISA tables.
* Compiled and edited by the Japan in Data editorial team based on official government statistics.
By nationality and region at the end of 2025, China was the largest group at 930,428, followed by Vietnam at 681,100, South Korea at 407,341, the Philippines at 356,579 and Nepal at 300,992. The top 10 nationalities and regions together totaled 3,487,474, or 84.5% of all foreign residents (our calculation).
Vietnam rose from 52,367 at the end of 2012 to 681,100 at the end of 2025, about 13.0 times in 13 years. Over the same period Nepal grew about 12.5 times, Indonesia about 10.4 times and Myanmar about 22.7 times (our calculation). Multiples come out larger for groups that were small in 2012. South Korea fell by 82,090 from 489,431 at the end of 2012.
In the ISA’s nationality and region categories, Vietnam overtook South Korea at the end of 2020, Nepal overtook Brazil at the end of 2024, and Indonesia overtook Brazil at the end of 2025. In the alien registration figures before 2012, China (606,889) overtook Korea, then counted as a single category (593,489), at the end of 2007.
How the Nationality Mix Has Changed
* Compiled and edited by the Japan in Data editorial team based on official government statistics.
At the end of 2012, the shares were China 32.1%, South Korea 24.1%, the Philippines 10.0% and Brazil 9.4%, together 75.5% (our calculation). At the end of 2025, they were China 22.6%, Vietnam 16.5%, South Korea 9.9%, the Philippines 8.6%, Nepal 7.3% and Indonesia 6.4%, so both the leading groups and their shares have changed places. Nationalities and regions outside the top 8 made up 19.1% at the end of 2012 and 19.2% at the end of 2025.
By Status of Residence: About 1 in 4 Are Permanent Residents
Stacking each year’s bar by status of residence makes it possible to compare which categories have widened.
* Compiled and edited by the Japan in Data editorial team based on official government statistics.
By status of residence at the end of 2025, Permanent Resident was the largest category at 947,125, about 1 in 4 foreign residents (23.0%). It was followed by Engineer/Specialist in Humanities/International Services at 475,790, Student at 464,784, Technical Intern Training at 456,618 and Specified Skilled Worker at 390,296.
Specified Skilled Worker (SSW) is a status of residence introduced on April 1, 2019. It grew from 15,663 at the end of 2020 to 390,296 at the end of 2025, about 25 times (our calculation). At the end of 2025, SSW (i) accounted for 382,341 and SSW (ii) for 7,955. Technical Intern Training stood at 456,618 at the end of 2025, against 456,595 at the end of 2024.
Special permanent residents hold a status under the Special Act on the Immigration Control of Those Who Have Lost Japanese Nationality Pursuant to the Treaty of Peace with Japan, and are counted separately from mid- to long-term residents. Their number fell from 304,430 at the end of 2020 to 266,896 at the end of 2025, or 6.5% of the total. Permanent residents and special permanent residents together number 1,214,021 (29.4%, our calculation).
By Prefecture: Tokyo Holds 19.4% of the National Total
A tile map shows the distribution across 47 prefectures in one view, including where the darker tiles cluster. Note that headcounts reflect the size of each prefecture’s population.
* Compiled and edited by the Japan in Data editorial team based on official government statistics.
By prefecture at the end of 2025, Tokyo had the most foreign residents at 801,438, or 19.4% of the national total, and 62,492 (8.5%) more than a year earlier. That works out to about 1 in 5 foreign residents living in Tokyo (our calculation). Osaka Prefecture ranked second with 375,319, Aichi Prefecture third with 357,800, Kanagawa Prefecture fourth with 317,353 and Saitama Prefecture fifth with 290,937.
The top six prefectures (Tokyo, Osaka, Aichi, Kanagawa, Saitama and Chiba) together accounted for 2,402,510, or 58.2% of the national total (our calculation). The smallest count was in Akita Prefecture, with 6,333 (about 6,000 on the tile map), followed by Tottori with 6,511, Kochi with 7,355, Aomori with 9,419 and Tokushima with 9,717.
The colors on the tile map show headcounts, not shares of each prefecture’s population. The foreign resident count refers to the end of December, while prefectural population figures refer to October 1. With the reference dates differing, this article does not calculate a foreign resident share for each prefecture.
Foreign Resident Count vs. Census Foreign Population: How They Differ
The two “counts of foreigners”, measured in different ways, are set out as definition cards and a comparison table rather than as a chart comparing lengths.
Definitions of the two counts of foreign nationals
They differ in reference date, method and coverage, so the two values cannot be compared on the same scale.
Foreign residents
Immigration Services Agency, Statistics on Foreign Residents
4,125,395
End of December 2025; released March 27, 2026
Mid- to long-term residents and special permanent residents, compiled from residence card and related records
Foreign population
Statistics Bureau of Japan, Population Census
3.84 million
October 1, 2025; 3.1% of total population; released September 29, 2026
Foreign nationals who have lived, or are expected to live, in Japan for 3 months or more, counted by questionnaire in a complete enumeration
| Item | Foreign residents | Foreign population (census) |
|---|---|---|
| Reference date | End of December (end-June figures also published, twice a year) | October 1 (every 5 years) |
| Method | Compiled from residence card and related records | Complete enumeration by questionnaire |
| Coverage | Mid- to long-term residents and special permanent residents. Excludes short-term visitors such as tourists, people with a period of stay of 3 months or less, and holders of the Diplomat or Official status | Foreign nationals who have lived, or are expected to live, in Japan for 3 months or more. Excludes members of foreign diplomatic missions and consular posts, foreign military personnel and civilian employees, and their families |
| Publisher | Immigration Services Agency of Japan | Statistics Bureau, Ministry of Internal Affairs and Communications |
* Compiled and edited by the Japan in Data editorial team based on official government statistics.
In the basic complete tabulation of the 2025 Population Census, released by the Statistics Bureau on September 29, 2026, the foreign population as of October 1, 2025 was 3.84 million, or 3.1% of the total population. That was 1.094 million (39.8%) more than in the previous census in 2020. A 3.1% share of the total population is about 1 in 32 people (our calculation).
The census is a complete enumeration that uses questionnaires to count everyone, including foreign nationals, who as of October 1 has lived or is expected to live in Japan for 3 months or more. Members of foreign diplomatic missions and consular posts and their families, and foreign military personnel and civilian employees and their families, are not covered.
The foreign resident count, by contrast, is the end-of-December number compiled by the ISA from residence card and related records, covering mid- to long-term residents and special permanent residents. The reference dates and methods differ, so the two figures cannot be compared by subtracting one from the other, and neither one is the correct figure in place of the other.
Tables by Year, Nationality and Prefecture
Exact figures for each year are in the tables below. You can switch between the views by year, by nationality and by prefecture.
Foreign resident counts in the tables are the ISA’s end-of-December figures for each year. The year-on-year changes and growth rates by year, and the changes by nationality, were calculated by the Japan in Data editorial team. The tables list the 20 main nationalities and regions in the ISA’s table and all 47 prefectures.
Foreign residents (mid- to long-term residents plus special permanent residents, end of December each year). Changes and growth rates were calculated by the editorial team from published figures. Years before 2012 are not listed because they were counted differently.
| Year-end | Foreign residents | Change | Change (%) |
|---|---|---|---|
| 2012 | 2,033,656 | Base | Base |
| 2013 | 2,066,445 | +32,789 | +1.6% |
| 2014 | 2,121,831 | +55,386 | +2.7% |
| 2015 | 2,232,189 | +110,358 | +5.2% |
| 2016 | 2,382,822 | +150,633 | +6.7% |
| 2017 | 2,561,848 | +179,026 | +7.5% |
| 2018 | 2,731,093 | +169,245 | +6.6% |
| 2019 | 2,933,137 | +202,044 | +7.4% |
| 2020 | 2,887,116 | -46,021 | -1.6% |
| 2021 | 2,760,635 | -126,481 | -4.4% |
| 2022 | 3,075,213 | +314,578 | +11.4% |
| 2023 | 3,410,992 | +335,779 | +10.9% |
| 2024 | 3,768,977 | +357,985 | +10.5% |
| 2025 | 4,125,395 | +356,418 | +9.5% |
The 20 main nationalities and regions in the ISA table, in descending order at the end of 2025. South Korea and Chosen are counted separately. Changes were calculated by the editorial team.
| Nationality/region | End-2012 | End-2025 | Change |
|---|---|---|---|
| Total | 2,033,656 | 4,125,395 | +2,091,739 |
| China | 652,595 | 930,428 | +277,833 |
| Vietnam | 52,367 | 681,100 | +628,733 |
| South Korea | 489,431 | 407,341 | -82,090 |
| Philippines | 202,985 | 356,579 | +153,594 |
| Nepal | 24,071 | 300,992 | +276,921 |
| Indonesia | 25,532 | 266,069 | +240,537 |
| Brazil | 190,609 | 210,014 | +19,405 |
| Myanmar | 8,046 | 182,567 | +174,521 |
| Sri Lanka | 8,428 | 79,128 | +70,700 |
| Taiwan | 22,775 | 73,256 | +50,481 |
| United States | 48,361 | 69,787 | +21,426 |
| Thailand | 40,133 | 67,097 | +26,964 |
| India | 21,654 | 58,999 | +37,345 |
| Peru | 49,255 | 49,020 | -235 |
| Bangladesh | 8,622 | 44,938 | +36,316 |
| Pakistan | 10,599 | 34,911 | +24,312 |
| Cambodia | 2,862 | 28,957 | +26,095 |
| United Kingdom | 14,653 | 22,428 | +7,775 |
| Chosen | 40,617 | 22,201 | -18,416 |
| Mongolia | 4,837 | 21,359 | +16,522 |
Foreign residents by prefecture at the end of December 2025. Shares are of the national foreign resident total (4,125,395), not of each prefecture’s population.
| Rank | Prefecture | People | Share |
|---|---|---|---|
| 1 | Tokyo | 801,438 | 19.4% |
| 2 | Osaka | 375,319 | 9.1% |
| 3 | Aichi | 357,800 | 8.7% |
| 4 | Kanagawa | 317,353 | 7.7% |
| 5 | Saitama | 290,937 | 7.1% |
| 6 | Chiba | 259,663 | 6.3% |
| 7 | Hyogo | 155,019 | 3.8% |
| 8 | Shizuoka | 132,100 | 3.2% |
| 9 | Fukuoka | 125,501 | 3.0% |
| 10 | Ibaraki | 111,808 | 2.7% |
| 11 | Kyoto | 92,563 | 2.2% |
| 12 | Gunma | 89,670 | 2.2% |
| 13 | Gifu | 80,766 | 2.0% |
| 14 | Hokkaido | 77,401 | 1.9% |
| 15 | Mie | 73,551 | 1.8% |
| 16 | Hiroshima | 72,628 | 1.8% |
| 17 | Tochigi | 61,878 | 1.5% |
| 18 | Nagano | 50,655 | 1.2% |
| 19 | Shiga | 46,180 | 1.1% |
| 20 | Okayama | 41,840 | 1.0% |
| 21 | Okinawa | 33,402 | 0.8% |
| 22 | Miyagi | 32,903 | 0.8% |
| 23 | Kumamoto | 32,372 | 0.8% |
| 24 | Niigata | 26,724 | 0.6% |
| 25 | Toyama | 26,296 | 0.6% |
| 26 | Yamanashi | 25,313 | 0.6% |
| 27 | Ishikawa | 23,498 | 0.6% |
| 28 | Oita | 23,027 | 0.6% |
| 29 | Yamaguchi | 22,539 | 0.5% |
| 30 | Kagawa | 21,791 | 0.5% |
| 31 | Nara | 21,623 | 0.5% |
| 32 | Fukushima | 21,598 | 0.5% |
| 33 | Fukui | 21,509 | 0.5% |
| 34 | Kagoshima | 21,480 | 0.5% |
| 35 | Ehime | 20,282 | 0.5% |
| 36 | Nagasaki | 17,477 | 0.4% |
| 37 | Miyazaki | 12,981 | 0.3% |
| 38 | Saga | 12,841 | 0.3% |
| 39 | Iwate | 12,526 | 0.3% |
| 40 | Shimane | 11,940 | 0.3% |
| 41 | Wakayama | 11,529 | 0.3% |
| 42 | Yamagata | 11,111 | 0.3% |
| 43 | Tokushima | 9,717 | 0.2% |
| 44 | Aomori | 9,419 | 0.2% |
| 45 | Kochi | 7,355 | 0.2% |
| 46 | Tottori | 6,511 | 0.2% |
| 47 | Akita | 6,333 | 0.2% |
| n/a | Undetermined/unknown | 7,228 | 0.2% |
* Compiled and edited by the Japan in Data editorial team based on official government statistics.
Kaede’s Summary: A Long Rise That Did Not Follow a Straight Line
With the 70-year trend, the breakdowns by nationality, status of residence and prefecture, and the definitions of the two counts side by side, the same “number of foreigners” looks different depending on the yardstick. Here are three observations.
To the question of how much the foreign resident population has grown, this article has set out charts using five yardsticks: the total, the year-on-year change, nationality, status of residence and prefecture. Without attaching any evaluation to the size of the numbers, the patterns that emerged are summarized below as observations.
The foreign resident count appears as a combination of a long rise over 70 years and a movement that was not a straight line, with declines at the end of 2020 and 2021. The answer to “how much has it grown” changes shape depending on which statistic, which reference date and which category is used, and the figures read more clearly when that is kept in view.
Frequently Asked Questions
Here are five points that are easy to misread in foreign resident figures: the difference from tourists, the definitions of terms, the relationship with the census, figures before 2012, and the label “Chosen”.
Q1. Does the Foreign Resident Count Include Tourists?
No. The foreign resident count is the total of mid- to long-term residents and special permanent residents. It does not count short-term visitors such as tourists, people with a period of stay of 3 months or less, or holders of the Diplomat or Official status. The number of visitors arriving in Japan for travel and other purposes comes from separate statistics.
Q2. How Many Immigrants Live in Japan?
The ISA’s statistics have no category called “immigrants”. This article uses the ISA’s foreign resident count (mid- to long-term residents plus special permanent residents). The count at the end of 2025 was 4,125,395, and the breakdown by status of residence is shown in the chart in the main text.
Q3. Which Is Correct, the Census Foreign Population or the Foreign Resident Count?
Both are official published figures, counted in different ways. The census foreign population was 3.84 million as of October 1, 2025, the result of a complete enumeration by questionnaire. The foreign resident count was 4,125,395 at the end of December 2025, compiled from residence card and related records. The reference dates and coverage differ, so the gap between the two cannot be used as a comparison.
Q4. Can the Figures Be Compared With Those Before 2012?
Not directly. On July 9, 2012, the alien registration system was abolished and the statistics were redefined to cover mid- to long-term residents and special permanent residents. Figures for 1990 to 2011 are values the ISA recalculated to approximate the current definition, and figures up to 1985 are alien registration counts. The chart in this article shows them with different line styles.
Q5. What Does “Chosen” Mean as a Nationality or Region?
The ISA’s statistics follow the nationality or region shown on residence cards and related documents, and “Chosen” (Korea) is a label used in those records, not the name of a country. The ISA tables count South Korea and Chosen separately, and Chosen accounted for 22,201 at the end of 2025. Rankings in this article follow these categories as they are.
🔍 About the Fact-Check for This Article
Japan in Data fact-checks its articles. The evidence behind the fact-check for this page is set out below.