
Whether autumn leaves now turn later is easier to judge from 73 years of observations, one bar per year, than from the impression of any single season. Drawing each year’s difference from normal as a bar above or below the line shows when the dates began to shift later.
The Japan Meteorological Agency (JMA) observes the maple leaf-color date at 51 sites across Japan. It is the first day on which most of the leaves on a designated sample tree, viewed as a whole, have turned red. It is not the same as the peak viewing period described in tourist guides.
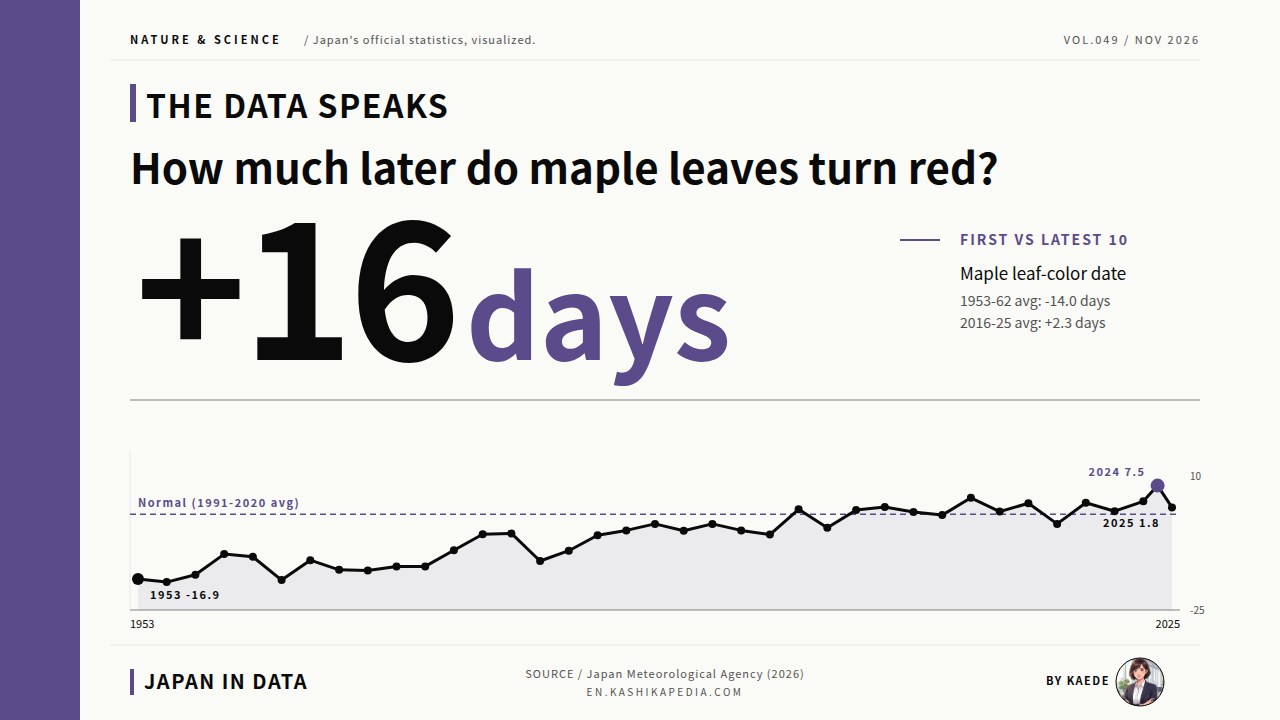
According to the JMA, this date has been moving later at a national average rate of about 3.1 days per decade (1953 to 2024). Comparing the averages of the first 10 years (1953 to 1962) and the latest 10 years (2016 to 2025), the leaf-color date differs by about 16 days, a little over two weeks. (Our calculation: 16.3 ÷ 7 ≈ 2.3 weeks.)
This article draws on the JMA’s Phenological Observation Annual Records (as of March 19, 2026, covering data through 2025) and Climate Change in Japan 2025, published by the Ministry of Education, Culture, Sports, Science and Technology (MEXT) and the JMA. It sets out 73 years of national differences from normal as annual columns, then decade averages, changes at 35 sites, the latest and earliest years, and a comparison with spring cherry blossoms.
The Japan Meteorological Agency (JMA) has recorded plant phenology at its observation sites since 1953 using a standardized nationwide method. For maples, it records the leaf-color date: the first day most leaves on a designated sample tree have turned red. This is not the same as the peak viewing period described by tourist sites. In this article, the normal is the 1991 to 2020 average for each site, and the national figure is the average difference from normal across the sites that reported in that year.
How much later do maple leaves turn red after 73 years of observation?
The maple leaf-color date in the latest 10 years is about 16 days later than in the first 10.
Maple leaf-color date (51 sites) ▲3.1d Long-term trend, 1953 to 2024 JMA figure
Maple leaf-color date (national avg) ▲16d -14.0 days (1953-62) to +2.3 days (2016-25) Over two weeks
Figures are current as of the time of writing. Statistics, rules and services are subject to change, so please check the official sources for the latest information.
- What Is the JMA Leaf-Color Date, and Is It Peak Viewing?
- How Has the National Average Moved Over 73 Years?
- Decade by Decade: Where Did the Biggest Shift Occur?
- Comparing 30-Year Averages: How Many Sites Shifted Later?
- Which Years Were the Latest and the Earliest?
- How Does It Compare With Spring Cherry Blossoms?
- Year-by-Year Figures
- Kaede’s Summary: The Maple Leaf-Color Date Has Moved Later Across the Long Record
- Frequently Asked Questions
- 🔍 About the Fact-Check for This Article
What Is the JMA Leaf-Color Date, and Is It Peak Viewing?
Before reading the numbers, the chart below sets out what the JMA defines as the leaf-color date. With the observation rules in view, it is easier to tell this date apart from peak viewing.
* Compiled and edited by the Japan in Data editorial team based on official government statistics.
The JMA’s leaf-color date is recorded on a tree chosen in advance, called the sample tree. It is the first day on which most of the leaves on that tree, viewed as a whole, have turned red. The main species is the iroha maple; where it does not grow, observers use yama-momiji, o-momiji or itaya-kaede. The leaf-color date marks the first day color has spread across the whole tree, not the length of the peak viewing period.
Observation under a unified nationwide method began in 1953. In January 2021, partly because suitable sample trees were becoming harder to secure, the JMA narrowed its plant observations to 6 species and 9 phenomena. Maple leaf coloring remained on the list, and its observation continues. Some private-sector peak viewing forecasts use this sample-tree standard to set their forecast dates.
How Has the National Average Moved Over 73 Years?
Splitting the 73 years into columns above and below the normal line, then overlaying a 5-year moving average, lets the year-to-year swings and the long-run direction be followed at the same time.
* Compiled and edited by the Japan in Data editorial team based on official government statistics.
The national difference from normal is calculated by taking each site’s leaf-color date minus that site’s normal (the 1991 to 2020 average), then averaging across the sites that reported in that year. In 1953 the date came 16.9 days earlier than normal, and in the first years of observation, dates around two weeks earlier than normal were common. The earliest year was 1955, at 17.7 days earlier than normal.
Following the columns, the first year later than normal appears in 1990. All 37 years from 1953 to 1989 were earlier than normal, while 24 of the 36 years from 1990 to 2025 were later than normal. Because the normal is the 1991 to 2020 average, however, the early part of the record tends to fall below zero, a point to keep in mind when reading the chart.
The latest year since 1953 was 2024, at 7.5 days later than normal, and 2025 came in at 1.8 days later than normal. Annual values swing up and down, but the 5-year moving average rose from -15.8 days in 1955 to -7.6 days in 1985 and to +2.3 days in 2005.
The JMA assesses that the maple leaf-color date has been moving later at a national average rate of about 3.1 days per decade (1953 to 2024). According to the JMA, the date is highly correlated with the average temperature before the leaves change color, and the agency states that the long-term rise in temperature is considered to have influenced this trend.
Decade by Decade: Where Did the Biggest Shift Occur?
Single years swing widely, so grouping them into 10-year averages makes it clearer in which decade the step was largest.
* Compiled and edited by the Japan in Data editorial team based on official government statistics.
By decade, the average difference from normal was -14.9 days for 1953 to 1959 (7 years), -13.5 days in the 1960s, -11.2 days in the 1970s and -7.7 days in the 1980s. It then moved to -1.7 days in the 1990s, +0.2 days in the 2000s, +1.2 days in the 2010s and +3.2 days for 2020 to 2025 (6 years). The largest step between neighboring periods is the 6.0 days from the 1980s to the 1990s.
Dividing the record differently, the first 10 years of observation (1953 to 1962) and the latest 10 years (2016 to 2025) average -14.0 days and +2.3 days, a gap of about 16 days. Limiting the calculation to sites with observations in both periods gives almost the same gap.
Comparing 30-Year Averages: How Many Sites Shifted Later?
A national average can still be pulled by a few sites. Joining each site’s two 30-year averages with dots and a line shows in a single chart whether the shifts point the same way.
* Compiled and edited by the Japan in Data editorial team based on official government statistics.
For cherry flowering dates, the JMA compares two 30-year averages, 1961 to 1990 and 1991 to 2020, site by site. This article applies the same comparison to the maple leaf-color date, using the 35 sites with at least 20 years of observations in each period. At all 35 sites, the leaf-color date is later in the 1991 to 2020 average.
The median shift is 10 days, and the smallest is 1 day, at Kobe and Hiroshima. From Hokkaido in the north to Kyushu in the southwest, no site moved earlier. Tokyo, Kyoto, Osaka and some other sites are not included because one of the two periods has fewer than 20 years of observations. Each site’s difference was calculated after rounding each period’s average date to the nearest day.
The observations include replacements of sample trees and changes in the observation location (on the station grounds or nearby) and in the species observed (iroha maple or a substitute species). The difference at each site is therefore a value that also contains these changes in observation conditions.
Which Years Were the Latest and the Earliest?
Placing the latest and earliest years side by side shows at a glance which periods each top 10 list falls in.
* Compiled and edited by the Japan in Data editorial team based on official government statistics.
Sorting the 73 years of national differences from normal, the 10 latest years begin with 2024 (+7.5 days), followed by 2006, 2011, 2004 and 2023. All ten of the latest years fall in 1998 or later. The 10 earliest years begin with 1955 (-17.7 days), followed by 1963 and 1953, and all fall in 1974 or earlier.
The top 10 lists set individual annual values side by side, and annual values move up and down considerably from one year to the next. Reading the lists together with the annual chart and the decade averages, rather than judging the long-run trend from single years, confirms the direction of the movement.
How Does It Compare With Spring Cherry Blossoms?
Set beside cherry blossoms, which are part of the same phenological observations, the autumn leaf-color date and the spring flowering date differ in both the direction and the pace of change.
* Compiled and edited by the Japan in Data editorial team based on official government statistics.
Climate Change in Japan 2025, published by MEXT and the JMA, reports that between 1953 and 2024 the cherry flowering date moved about 1.2 days earlier per decade, while the maple leaf-color date moved about 3.1 days later per decade. The figures cover 58 observation sites for cherry and 51 sites for maple.
Spring cherry blossoms are moving earlier and autumn maples later. In pace, the leaf-color date is shifting about 2.6 times as fast as the cherry flowering date. (Our calculation: 3.1 ÷ 1.2 ≈ 2.6.) The flowering dates are charted in detail in our article on cherry blossom flowering dates.
Year-by-Year Figures
To check the exact value for any year, use this table. The tabs switch between periods.
The table lists the national difference from normal for each year and the number of sites that reported. The count began at 27 sites in 1953, reached 51 at most, and was 50 in 2025. Because the number of sites varies by year, each value is the average across the sites that reported in that year.
| Year | vs. normal (days) | Sites |
|---|---|---|
| 1953 | -16.9 | 27 |
| 1954 | -14.9 | 29 |
| 1955 | -17.7 | 34 |
| 1956 | -13.5 | 36 |
| 1957 | -15.8 | 38 |
| 1958 | -14.9 | 35 |
| 1959 | -10.4 | 29 |
| 1960 | -12.4 | 32 |
| 1961 | -11.1 | 36 |
| 1962 | -12.5 | 33 |
| 1963 | -17.2 | 33 |
| 1964 | -14.4 | 30 |
| 1965 | -12.0 | 29 |
| 1966 | -11.7 | 30 |
| 1967 | -14.5 | 30 |
| 1968 | -13.8 | 32 |
| 1969 | -14.7 | 29 |
| 1970 | -12.8 | 29 |
| 1971 | -13.6 | 30 |
| 1972 | -12.3 | 29 |
| 1973 | -13.6 | 28 |
| 1974 | -15.8 | 31 |
| 1975 | -9.4 | 34 |
| 1976 | -13.7 | 36 |
| 1977 | -5.2 | 36 |
| Year | vs. normal (days) | Sites |
|---|---|---|
| 1978 | -10.2 | 40 |
| 1979 | -5.0 | 40 |
| 1980 | -10.9 | 37 |
| 1981 | -12.2 | 41 |
| 1982 | -6.0 | 42 |
| 1983 | -9.5 | 43 |
| 1984 | -8.0 | 44 |
| 1985 | -5.5 | 41 |
| 1986 | -11.0 | 46 |
| 1987 | -4.2 | 47 |
| 1988 | -7.0 | 46 |
| 1989 | -2.5 | 48 |
| 1990 | +1.4 | 48 |
| 1991 | -4.3 | 44 |
| 1992 | -4.6 | 47 |
| 1993 | -2.5 | 50 |
| 1994 | +1.9 | 49 |
| 1995 | -4.2 | 50 |
| 1996 | -3.0 | 49 |
| 1997 | -5.3 | 49 |
| 1998 | +2.7 | 50 |
| 1999 | +1.3 | 47 |
| 2000 | +1.2 | 50 |
| 2001 | -3.5 | 51 |
| Year | vs. normal (days) | Sites |
|---|---|---|
| 2002 | -7.0 | 50 |
| 2003 | +1.1 | 50 |
| 2004 | +3.5 | 47 |
| 2005 | +1.9 | 51 |
| 2006 | +4.7 | 48 |
| 2007 | +0.6 | 48 |
| 2008 | -0.7 | 49 |
| 2009 | -0.2 | 50 |
| 2010 | +0.8 | 51 |
| 2011 | +4.3 | 50 |
| 2012 | +0.7 | 48 |
| 2013 | +0.7 | 50 |
| 2014 | -0.7 | 47 |
| 2015 | +2.9 | 50 |
| 2016 | +0.2 | 47 |
| 2017 | -2.5 | 48 |
| 2018 | +2.5 | 47 |
| 2019 | +3.0 | 48 |
| 2020 | +3.0 | 48 |
| 2021 | +0.8 | 49 |
| 2022 | +3.0 | 50 |
| 2023 | +3.4 | 49 |
| 2024 | +7.5 | 50 |
| 2025 | +1.8 | 50 |
* Compiled and edited by the Japan in Data editorial team based on official government statistics.
Kaede’s Summary: The Maple Leaf-Color Date Has Moved Later Across the Long Record
Laid side by side, the charts show the maple leaf-color date moving toward later dates across the long record. Here it is set out as three observed facts.
Starting from the question of how much later autumn color has become, this article has set out the JMA’s leaf-color data in three ways: by year, by decade and by site. The observations below describe the movement of dates recorded under fixed observation rules, not the peak viewing period as such.
Taken together, the three observations show the maple leaf-color date moving later in both the national average and the site-level 30-year averages. Because the records include changes in sample trees and observation locations, the figures here are summarized across long periods and many sites rather than read from a single year or a single site.
Frequently Asked Questions
When reading a leaf-color chart, three things go together: what the date records, which normal the difference is measured against, and whether the set of observation sites is consistent.
Q1. Is the JMA Leaf-Color Date the Same as Peak Viewing at Tourist Spots?
No. The JMA’s leaf-color date is the first day on which most of the leaves on a sample tree, viewed as a whole, have turned red. The peak viewing period announced by tourist spots describes when color is at its height for a given place or species, and it is determined differently. Some private-sector peak viewing forecasts base their dates on the JMA’s sample-tree observation standard.
Q2. Have the Observation Sites and Trees Stayed the Same?
No. The number of sites varies by year: 27 in 1953 and up to 51 in later years. Sample trees have been replaced, and observation locations and species have changed. Maple leaf coloring has continued to be observed since the January 2021 revision of observation items. The JMA also observes the yellowing of ginkgo leaves, but this article covers the maple leaf-color date only.
Q3. Where Can the Latest Observations Be Found?
The JMA’s phenological observation information page provides recent observation data and annual records for each site. The figures in this article are the values through 2025 in the annual records as of March 19, 2026. Observations for autumn 2026 can be found on the same page after the annual records are updated.
🔍 About the Fact-Check for This Article
Japan in Data fact-checks its articles. The evidence behind the fact-check for this page is set out below.