How much does Japan’s aging rate differ between prefectures?
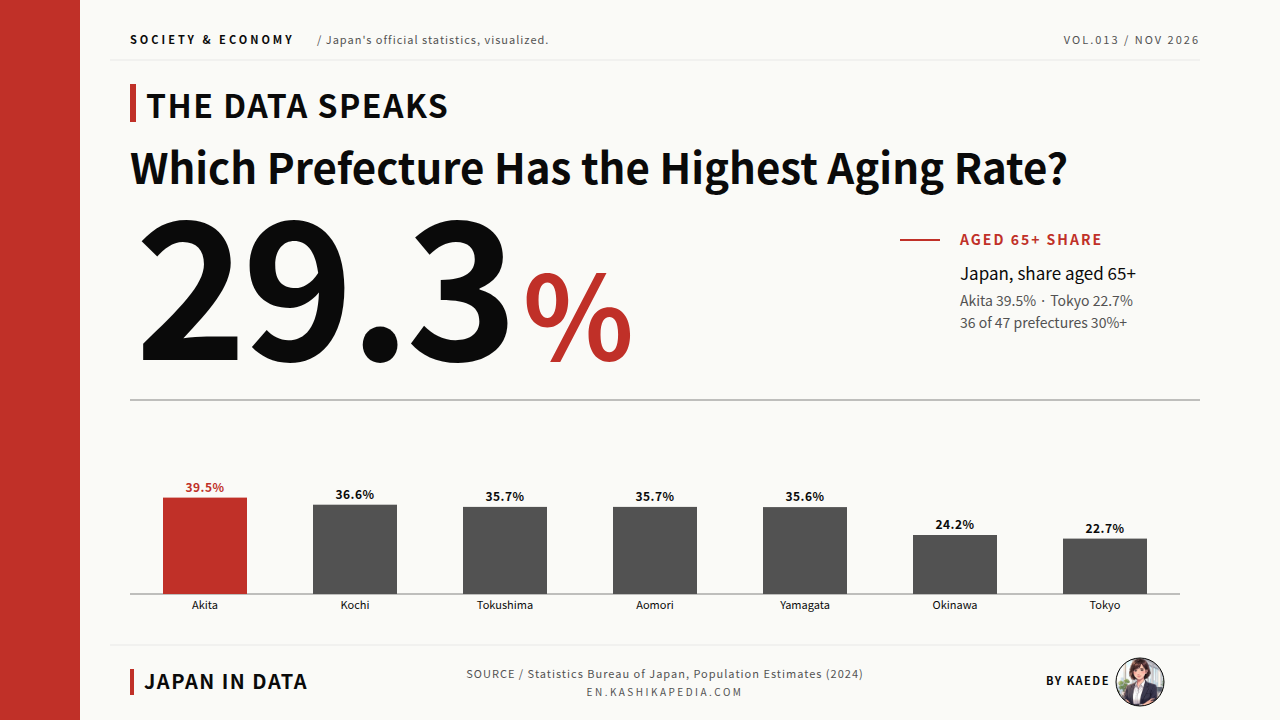
Japan overall is 29.3%. Akita, the highest, and Tokyo, the lowest, differ by 16.8 points.

The quickest way to see whether one prefecture’s aging rate is high or low is to set all 47 side by side, on a single map and in a single list. Placed next to the national average, the size of the regional differences becomes clear.
As of October 1, 2024, Japan’s aging rate, the share of the total population aged 65 or over, stood at 29.3%. By prefecture, the highest was Akita Prefecture at 39.5% and the lowest was Tokyo at 22.7%, a gap of 16.8 percentage points. In 36 prefectures the rate was 30% or more, and the top of the ranking is concentrated in regional areas such as Tohoku, Shikoku and San’in.
This article uses the final figures from the Statistics Bureau of Japan’s Population Estimates as of October 1, 2024 to set out the aging rate in all 47 prefectures as a tile map, a geographic map and a full ranked table. It also draws on projections from the National Institute of Population and Social Security Research to show how far each prefecture’s rate is projected to rise by 2050, placing the current picture beside the projected one.
Japan’s aging rate is the share of the total population aged 65 or over. The figures here come from the Population Estimates of the Statistics Bureau of Japan, part of the Ministry of Internal Affairs and Communications, and describe the population as of October 1, 2024. Prefectures are Japan’s 47 top-level administrative regions, from Hokkaido in the north to Okinawa in the southwest. Figures for 2050 are projections by the National Institute of Population and Social Security Research (IPSS), not recorded values.
Figures are current as of the time of writing. Statistics, rules and services are subject to change, so please check the official sources for the latest information.
- Japan’s Aging Rate Is 29.3%, With a 16.8-Point Gap Between Prefectures
- The Highest Rates Cluster in Tohoku, Shikoku and San’in
- 36 Prefectures at 30% or More, With Tohoku Leading the Top 10
- 25 Prefectures Projected to Reach 40% or More by 2050
- The Share Aged 75 and Over Ranges From 11.7% to 22.0%
- Aging Rate in All 47 Prefectures: The Full Ranking
- Kaede’s Summary: Higher Rates in Regional Japan, Wide Variation Ahead
- Frequently Asked Questions
- 🔍 About the Fact-Check for This Article
Japan’s Aging Rate Is 29.3%, With a 16.8-Point Gap Between Prefectures
To start, the tile map sets all 47 prefectures at equal size so that each one’s position is easy to compare. The darker the tile, the higher the aging rate.
* Compiled and edited by the Japan in Data editorial team based on official government statistics.
Japan’s aging rate in 2024 was 29.3%. The population aged 65 or over numbered 36.243 million, about three in ten of all residents. By prefecture, the highest rate was Akita’s 39.5% and the lowest was Tokyo’s 22.7%, a difference of 16.8 percentage points.
In 36 prefectures, the aging rate is 30% or more, about eight in ten of Japan’s 47. The 11 prefectures below 30% are Tokyo, Aichi, Okinawa, Kanagawa, Shiga, Saitama Prefecture, Osaka, Chiba, Fukuoka, Miyagi and Kyoto, with rates ranging from 22.7% in Tokyo to 29.8% in Kyoto.
The Highest Rates Cluster in Tohoku, Shikoku and San’in
Next comes a map drawn in Japan’s real shape. Where the tile map shows each prefecture’s rank on equal terms, this view shows which regions the high rates gather in.
* Compiled and edited by the Japan in Data editorial team based on official government statistics.
On the map, prefectures with high aging rates gather in Tohoku in the northeast, in Shikoku, in San’in and in western Kyushu. In Tohoku, Akita (39.5%), Aomori (35.7%), Yamagata (35.6%) and Iwate (35.4%) stand at high levels; in Shikoku, Kochi (36.6%), Tokushima (35.7%) and Ehime (34.5%); and in San’in, Shimane (35.2%) and Yamaguchi (35.5%).
Prefectures with low aging rates, by contrast, are found in the large metropolitan areas of Tokyo, Kanagawa, Aichi, Osaka, Saitama and Chiba, and in Okinawa. The six Tohoku prefectures averaged 34.9%, 5.6 points above the national rate of 29.3%.
36 Prefectures at 30% or More, With Tohoku Leading the Top 10
Here the ten highest and ten lowest prefectures are set out as horizontal bars. Side by side, the kinds of regions at each end of the ranking come into view.
* Compiled and edited by the Japan in Data editorial team based on official government statistics.
The top ten are led by Akita (39.5%), followed by Kochi, Tokushima, Aomori, Yamagata, Yamaguchi, Iwate, Shimane, Nagasaki and Ehime, mostly prefectures in Tohoku and Shikoku. The bottom ten, from the lowest, are Tokyo (22.7%), Okinawa, Aichi, Kanagawa, Shiga, Saitama, Osaka, Chiba, Fukuoka and Miyagi.
The two ends of the ranking also differ in population structure. In this distribution, large metropolitan areas that continue to draw younger residents tend to have lower aging rates, while regional areas with continuing population outflows tend to have higher ones.
25 Prefectures Projected to Reach 40% or More by 2050
From here the focus moves to the years ahead. Using projections from the National Institute of Population and Social Security Research, the chart below shows the rise from 2024 to 2050. The 2050 values are projections, not recorded figures.
* Compiled and edited by the Japan in Data editorial team based on official government statistics.
According to the National Institute of Population and Social Security Research (IPSS), Regional Population Projections for Japan, 25 prefectures are projected to have an aging rate of 40% or more in 2050. The highest projected rate is Akita’s 49.9%, roughly one in two residents aged 65 or over. The lowest projection is Tokyo’s 29.6%.
The projected rise from 2024 to 2050 is largest in Aomori (+12.7 points), Iwate (+10.5), Fukushima (+10.5), Akita (+10.4) and Nara (+10.4), and smallest in Shimane (+4.5), Oita (+6.1), Kumamoto (+6.2) and Fukuoka (+6.5). The projections show two patterns: smaller rises in some prefectures already at high levels, and further increases ahead in prefectures that include large metropolitan areas (all projected values).
The Share Aged 75 and Over Ranges From 11.7% to 22.0%
The aging rate counts everyone aged 65 or over. It is also worth seeing how much of the population is aged 75 or over, since the size of this older group differs from prefecture to prefecture.
* Compiled and edited by the Japan in Data editorial team based on official government statistics.
Nationally, 16.8% of the population is aged 75 or over, ranging from 22.0% in Akita, the highest, to 11.7% in Okinawa, the lowest. Among the prefectures in the chart, those with a high share aged 65 or over also tend to have a high share aged 75 or over.
Okinawa is a distinct case. Its share aged 65 or over is 24.2%, while its share aged 75 or over is 11.7%, a relatively wide gap between the two measures. Some observers link this to the shape of Okinawa’s population structure after World War II. The balance between the two age groups differs from prefecture to prefecture.
Aging Rate in All 47 Prefectures: The Full Ranking
Finally, the aging rates of all 47 prefectures are listed with their ranks. The table makes it easy to find any prefecture and see where it stands.
| Rank | Prefecture | Aging rate | Aged 75+ |
|---|---|---|---|
| 1 | Akita | 39.5% | 22.0% |
| 2 | Kochi | 36.6% | 21.6% |
| 3 | Tokushima | 35.7% | 20.2% |
| 3 | Aomori | 35.7% | 19.5% |
| 5 | Yamagata | 35.6% | 19.6% |
| 6 | Yamaguchi | 35.5% | 20.9% |
| 7 | Iwate | 35.4% | 19.7% |
| 8 | Shimane | 35.2% | 20.4% |
| 9 | Nagasaki | 34.7% | 19.0% |
| 10 | Ehime | 34.5% | 19.7% |
| 10 | Wakayama | 34.5% | 20.1% |
| 12 | Oita | 34.4% | 19.6% |
| 13 | Niigata | 34.2% | 19.2% |
| 13 | Kagoshima | 34.2% | 18.4% |
| 15 | Miyazaki | 33.9% | 18.7% |
| 16 | Tottori | 33.7% | 18.9% |
| 16 | Fukushima | 33.7% | 17.9% |
| 18 | Hokkaido | 33.3% | 18.7% |
| 19 | Toyama | 33.2% | 19.7% |
| 20 | Nagano | 32.9% | 19.4% |
| 20 | Nara | 32.9% | 19.4% |
| 22 | Kagawa | 32.8% | 19.1% |
| 23 | Kumamoto | 32.6% | 18.0% |
| 24 | Yamanashi | 32.0% | 18.0% |
| Rank | Prefecture | Aging rate | Aged 75+ |
|---|---|---|---|
| 24 | Saga | 32.0% | 17.3% |
| 26 | Fukui | 31.8% | 18.0% |
| 27 | Gifu | 31.4% | 18.1% |
| 28 | Shizuoka | 31.2% | 17.8% |
| 28 | Okayama | 31.2% | 18.4% |
| 30 | Gunma | 31.1% | 17.6% |
| 31 | Mie | 30.9% | 17.8% |
| 31 | Ibaraki | 30.9% | 17.0% |
| 33 | Ishikawa | 30.7% | 17.9% |
| 34 | Tochigi | 30.5% | 16.4% |
| 35 | Hiroshima | 30.4% | 17.8% |
| 36 | Hyogo | 30.2% | 17.6% |
| 37 | Kyoto | 29.8% | 18.0% |
| 38 | Miyagi | 29.6% | 15.9% |
| 39 | Fukuoka | 28.6% | 15.9% |
| 40 | Chiba | 28.1% | 16.3% |
| 41 | Osaka | 27.6% | 16.7% |
| 42 | Saitama | 27.5% | 15.9% |
| 43 | Shiga | 27.3% | 15.3% |
| 44 | Kanagawa | 26.0% | 15.3% |
| 45 | Aichi | 25.8% | 15.0% |
| 46 | Okinawa | 24.2% | 11.7% |
| 47 | Tokyo | 22.7% | 13.2% |
Ranked from the highest aging rate (tied prefectures share the same rank). Darker dots indicate a higher aging rate.
Source: Statistics Bureau of Japan, Population Estimates (as of October 1, 2024), final figures. * Compiled by Japan in Data from official government statistics.
Ranked from highest to lowest, the top of the table is held by prefectures in Tohoku, Shikoku and San’in, and the bottom by the large metropolitan areas and Okinawa. Under the same word, aging, the share of residents aged 65 or over ranges from just over one in five to nearly two in five depending on the prefecture. All figures in the table are final values as of October 1, 2024.
Kaede’s Summary: Higher Rates in Regional Japan, Wide Variation Ahead
Setting the distribution and the projections side by side shows both the regional gaps in the aging rate and the range of rises ahead. They can be summed up in three observations.
The charts in this article have shown a distribution in which aging rates are high in regional areas and low in large metropolitan areas, along with projected rises that differ by prefecture. All values come from official statistics and do not indicate that any region is better or worse than another. They are set out here as observed facts.
Read together, the three observations show aging rates today ranging from just over one in five to nearly two in five, alongside differences in regional population structure, and projections indicate further rises in many prefectures, including those with large metropolitan areas (projected values). Where a given prefecture stands, and how it is projected to change, can be checked in the maps, the table and the projection chart above.
Frequently Asked Questions
When reading aging-rate data, three checks help avoid misreading the figures: the date the value refers to, whether it is a recorded figure or a projection, and whether it covers ages 65 and over or 75 and over.
Q1. What Is the Aging Rate?
It is the share of the total population aged 65 or over. This article is based on the final figures of the Statistics Bureau of Japan’s Population Estimates as of October 1, 2024. In 2024, Japan’s national aging rate was 29.3%, with 36.243 million people aged 65 or over.
Q2. Which Prefecture Had the Highest Aging Rate in 2024?
Akita, at 39.5%. Kochi followed at 36.6%, and Tokushima and Aomori were tied at 35.7%. The lowest was Tokyo at 22.7%, 16.8 percentage points below Akita. In total, 36 of the 47 prefectures had an aging rate of 30% or more.
Q3. Is the Aging Rate Projected to Keep Rising?
According to the National Institute of Population and Social Security Research, Regional Population Projections for Japan, the aging rate is projected to rise in every prefecture by 2050, with 25 prefectures reaching 40% or more. The highest projected rate in 2050 is Akita’s 49.9% (all projected values).
🔍 About the Fact-Check for This Article
Japan in Data fact-checks its articles. The evidence behind the fact-check for this page is listed below.