
When summers feel hotter than they used to, lining up the number of hot days year by year shows how many more there actually are. Separating days of 30°C or above from days of 35°C or above also shows that the two have grown in quite different ways.
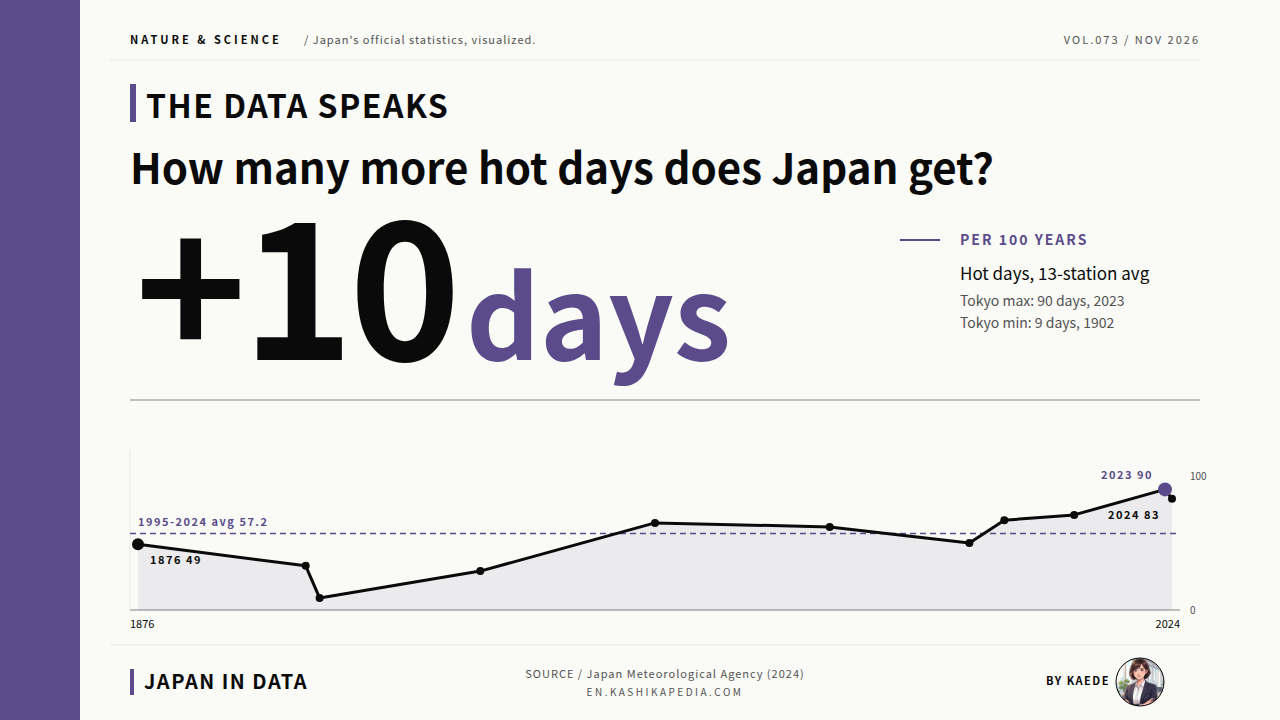
In Japan, a manatsubi, or hot day, is a day with a maximum temperature of 30°C or higher, and a mōshobi, or extremely hot day, is one of 35°C or higher. Averaged across 13 stations that the Japan Meteorological Agency (JMA) regards as relatively little affected by urbanization, hot days have increased by 10 days per 100 years and extremely hot days by 3 days. The series runs from 1929 to 2024.
Narrowing the view to Tokyo makes the difference sharper. The annual number of hot days rose from an average of 39.5 in 1910 to 1939 to an average of 57.2 in 1995 to 2024. Over the same periods, extremely hot days went from 0.5 to 7.0 a year. Days of 35°C or above once came about once every two years in Tokyo; over the latest 30 years there have been about seven a year (our calculation).
This article draws on the JMA’s Heat Island Phenomenon data on days by temperature class, its annual day counts for 11 major cities, and projections from Climate Change in Japan 2025, published by the Ministry of Education, Culture, Sports, Science and Technology (MEXT) and the JMA. It covers Tokyo’s 149-year record, the gap between 30°C and 35°C days, four indicators, city differences and end-of-century projections.
Japan’s temperature records come from the Japan Meteorological Agency (JMA), which has kept daily observations in Tokyo since 1876. The JMA classifies days by temperature: a manatsubi (hot day) has a daily maximum of 30°C or higher, and a mōshobi (extremely hot day) reaches 35°C or higher. For national trends, the JMA averages 13 long-running stations regarded as relatively little affected by urbanization. Figures are counts of days per calendar year at a single station, not totals across the country.
How many more days of 30°C or above does Japan have than before?
Up 10 days per 100 years, on the 13-station national average.
Source: Japan Meteorological Agency, Heat Island Phenomenon 1.3: Long-Term Trends in Days by Temperature Class (1929 to 2024); Japan Meteorological Agency, Long-Term Trends in Hot Days and Extremely Hot Days in Major Cities, Tokyo (1876 to 2024)
* Compiled and edited by the Japan in Data editorial team based on official government statistics.
Figures are current as of the time of writing. Statistics, rules and services are subject to change, so please check the official sources for the latest information.
Related reading
Cherry blossom flowering dates in Japan, visualized →
Bears in Japan: the trend data, visualized →
Japan’s hot springs (onsen), by the numbers →
- How Have Tokyo’s Hot Days Changed Over 149 Years?
- Days of 30°C and Days of 35°C Have Grown Differently
- What Does “Nationwide” Mean? The 13-Station Average
- Days Gained and Days Lost, Measured on One Scale
- How Much Does the Increase Differ from City to City?
- What Do Official Projections Show for the Future?
- Kaede’s Summary: 30°C Days and 35°C Days Are Rising in Different Ways
- Frequently Asked Questions
- 🔍 About the Fact-Check for This Article
How Have Tokyo’s Hot Days Changed Over 149 Years?
Annual counts swing widely from year to year, so a five-year moving average line is laid over the 149 bars. Compare the slope that runs underneath the swings with the swings themselves.
* Compiled and edited by the Japan in Data editorial team based on official government statistics.
The JMA publishes Tokyo’s annual count of hot days for 149 years, from 1876 to 2024. The values move up and down sharply from one year to the next: 49 days in 1876, 33 in 1900 and 65 in 1950. Annual counts range from a low of 9 days to a high of 90, and neighboring years often differ by more than 20 days.
The lowest count was 9 days in 1902 and the highest was 90 days in 2023. The second highest was 83 days in 2024, so the top two years are the two most recent. The five-year moving average moved between the 30s and the 50s from the 1880s to the 1940s, and has sat in the 50s and 60s since the 1990s.
One caution applies. Tokyo’s observation site was relocated in December 2014. The JMA treats data from before and after the move as not homogeneous and does not show a five-year moving average across it; this chart follows the same approach. No rate of change per 100 years is calculated for Tokyo either.
Days of 30°C and Days of 35°C Have Grown Differently
Even in the same city, days of 30°C or above and days of 35°C or above increase in different shapes. Look first at how extremely hot days appear in the upper bars, then move down to the comparison of 30-year averages.
* Compiled and edited by the Japan in Data editorial team based on official government statistics.
Laid out year by year, Tokyo’s extremely hot days stayed between zero and a few in almost every one of the 118 years from 1876 to 1993. The highest count in that span was 7 days, recorded in 1942 and in 1978, and no year recorded 8 or more days through 1993. Years with zero extremely hot days appear repeatedly.
The change appears in the 1990s. Tokyo recorded 8 days in 1994 and 13 in 1995, the first double-digit year since records began. Double-digit years have since become common: 13 in 2010, 12 in 2013, 12 in each year from 2018 to 2020, 16 in 2022, 22 in 2023 and 20 in 2024. In Climate Change in Japan 2025, MEXT and the JMA state that extremely hot days increased sharply from around the mid-1990s.
Comparing 30-year averages, Tokyo’s hot days rose from 39.5 in 1910 to 1939 to 57.2 in 1995 to 2024, an increase of 17.7 days, or about 1.4 times. Extremely hot days rose from 0.5 to 7.0 over the same periods, an increase of 6.5 days, or about 15 times. Hot days gained more days in absolute terms, while extremely hot days grew by a far larger multiple.
These 30-year averages are not the JMA’s official climate normals. The Japan in Data editorial team calculated them from the published annual counts. Because Tokyo’s observation site has been relocated, the data are presented as a comparison of averages for each period rather than as a rate of change.
What Does “Nationwide” Mean? The 13-Station Average
When the JMA describes national trends, it uses an average of 13 stations. Setting that average beside the values for six major cities makes the yardstick easier to understand.
* Compiled and edited by the Japan in Data editorial team based on official government statistics.
When this article says “nationwide,” it does not mean an average of every station in Japan’s automated AMeDAS weather network. The JMA calculates Japan’s average temperature from 15 stations: Abashiri, Nemuro, Suttsu, Yamagata, Ishinomaki, Fushiki, Iida, Choshi, Sakai, Hamada, Hikone, Miyazaki, Tadotsu, Naze and Ishigakijima. The 13-station average excludes Iida and Miyazaki, where the effects of relocation and similar changes are difficult to remove.
On this 13-station average, hot days have increased by 10 days per 100 years and extremely hot days by 3 days. The figures are annual days at a single station, not a total of days across the country. Over the same period, hot days rose by 26 days per 100 years in Yokohama, 18 in Fukuoka, 17 in Nagoya and Kyoto, 15 in Sendai and 5 in Sapporo.
For extremely hot days, Kyoto rose by 17 days, Fukuoka by 14 and Nagoya by 13, close to their hot-day figures. Sapporo’s figure is 0 days; the JMA states that extremely hot days there are too rare to show a statistically significant trend. According to the JMA’s assessment, the higher rates in large cities reflect the effect of urbanization added to global warming.
Tokyo, Niigata, Osaka, Hiroshima and Kagoshima do not appear in this chart because the effects of their station relocations are difficult to remove. The JMA does not calculate a rate of change per 100 years for these five cities. Tokyo’s annual counts are published, but no comparable rate-of-change figure exists for the city.
Days Gained and Days Lost, Measured on One Scale
Looking only at the hot-side indicators makes some things easy to miss. Putting frost days and tropical nights on the same scale changes the order of which indicators moved the most.
* Compiled and edited by the Japan in Data editorial team based on official government statistics.
For the same 13-station average, the JMA also publishes rates of change for frost days, with a daily low below 0°C, and tropical nights, with a daily low of 25°C or above. All four series cover 1929 to 2024. Per 100 years, frost days decreased by 22 days, tropical nights increased by 20, hot days by 10 and extremely hot days by 3.
Arranged on either side of zero, the largest moves belong to frost days and tropical nights, while hot days and extremely hot days move less. Frost days and tropical nights are both defined by the daily minimum temperature, whereas hot days and extremely hot days are defined by the daily maximum temperature.
The JMA states that the temperature rise from urbanization is larger in winter than in summer and appears more in daily minimum than daily maximum temperatures. In the six major cities as well, frost days fell by between 47 days (Sapporo) and 71 days (Kyoto), and tropical nights rose by between 1 day (Sapporo) and 51 days (Fukuoka), wider ranges than for hot and extremely hot days.
How Much Does the Increase Differ from City to City?
For 11 major cities, the averages of an earlier 30-year period and the latest 30 years are set side by side. The length of each line equals the number of days added.
* Compiled and edited by the Japan in Data editorial team based on official government statistics.
For 11 major cities, the editorial team calculated 30-year averages for 1929 to 1958, the first span with data for all 11, and for 1995 to 2024. For hot days, cities that already had many rose further: Kyoto from 67.2 to 79.6 days, Kagoshima from 67.1 to 81.7 and Osaka from 65.1 to 77.7. The largest increase was in Hiroshima, at 21.3 days, followed by Yokohama at 18.2 days.
Sapporo went from 9.0 to 10.7 days, an increase of 1.7 days. Sendai went from 16.2 to 26.8, Niigata from 31.8 to 39.0 and Tokyo from 44.8 to 57.2. The level of hot days is higher in western Japan and lower in northern Japan, and that geographic gap holds in both periods.
For extremely hot days the order shifts slightly. In the earlier 30 years, Kyoto had the most at 11.0 days, followed by Nagoya at 8.1, while Tokyo had 1.2, Hiroshima 0.7 and Yokohama 0.3. In the latest 30 years, Kyoto recorded 22.2, Nagoya 16.9, Osaka 16.3, Fukuoka 10.0 and Hiroshima 9.7, with cities that once had few such days now nearing double digits.
The values here are period averages, not rates of change. Tokyo, Niigata, Osaka, Hiroshima and Kagoshima had station relocations, and their values include the effects of those moves. Because records begin in different years in each city, the earlier period is the 30 years from 1929, the first year with data for every city.
What Do Official Projections Show for the Future?
From here the subject moves from observations to projections. Projections are given as ranges, so error bars are included to show each range alongside its central value.
* Compiled and edited by the Japan in Data editorial team based on official government statistics.
In Climate Change in Japan 2025, MEXT and the JMA compare projected climate at the end of the 21st century (the 2076 to 2095 average) with the end of the 20th century (the 1980 to 1999 average). According to the report, extremely hot days are projected to rise by 2.9 days a year under a 2°C warming scenario and by 17.5 days under a 4°C scenario. These are national averages.
The report projects tropical nights to increase by 8.2 days a year under the 2°C scenario and by 38.0 days under the 4°C scenario, and frost days to decrease by 16.6 and 46.2 days respectively. Annual mean temperature itself is projected to rise by 1.4°C under the 2°C scenario and by 4.5°C under the 4°C scenario.
The 2°C scenario assumes that the goal of the Paris Agreement is met, and the 4°C scenario assumes that no additional mitigation measures are taken. The ranges attached to each value represent year-to-year variability in the future climate. The table does not include projections for the annual number of hot days.
Observed change and projected change are different kinds of figures. The rates per 100 years and the annual counts in the first half of this article are confirmed values based on observations, while the figures in this section come from climate models. The two sets of numbers are not directly comparable.
Kaede’s Summary: 30°C Days and 35°C Days Are Rising in Different Ways
Lining up the charts again shows that each indicator differs in both the size and the shape of its movement. They are summarized below as three observations.
To the question of how much hot days and extremely hot days have increased, the charts in this article gave a different answer for each indicator. The figures change with the choice of stations, the period covered and the temperature threshold. Without ranking the figures against each other, they are set out below as observations.
Read together, the three observations show that a single phrase, “more hot days,” covers several indicators that have grown in different ways. Hot days increased most in number of days, extremely hot days changed most as a multiple, and frost days and tropical nights moved the most per 100 years. The answer to “how much” depends on which indicator, station and period is examined.
Frequently Asked Questions
When reading temperature-day data, check three things together: which stations are used, the period covered and whether the observation site was relocated. These three points change what a figure means.
Q1. What Is the “13-Station Average” Used in This Article?
It is the average of 13 of the 15 stations the JMA uses to calculate Japan’s average temperature (Abashiri, Nemuro, Suttsu, Yamagata, Ishinomaki, Fushiki, Iida, Choshi, Sakai, Hamada, Hikone, Miyazaki, Tadotsu, Naze and Ishigakijima), excluding Miyazaki and Iida, where relocation effects are difficult to remove. It is not an average of all AMeDAS stations and reads as annual days at one station. The stations were chosen for relatively little environmental change from urbanization.
Q2. Why Is There No “Days per 100 Years” Figure for Tokyo?
Tokyo’s observation site was relocated in December 2014, so data from before and after the move are not homogeneous. The JMA states that no method has yet been established to correct for relocation effects on day counts based on daily maximum and minimum temperatures. It therefore calculates no rate per 100 years for Tokyo, Niigata, Osaka, Hiroshima or Kagoshima. Annual counts are published, so this article compares period averages instead.
Q3. Do the Figures in This Article Include the Summer of 2025?
No. The observation data on the JMA’s Heat Island Phenomenon pages run to 2024, and when these figures were compiled the next update was scheduled for July 2026. The annual counts, 30-year averages and rates per 100 years in this article are all based on data up to 2024. Records for 2025 are available from other JMA series, such as its historical weather data search.
🔍 About the Fact-Check for This Article
Japan in Data fact-checks its articles. The evidence for the fact-check on this page is set out below.