
A single line for the total is not enough to show how far Japan’s fish catch has fallen. Split into five stacked layers (distant-water, offshore, coastal, marine aquaculture and inland waters), the data shows that the total has shrunk and that the weight of its parts has changed places.
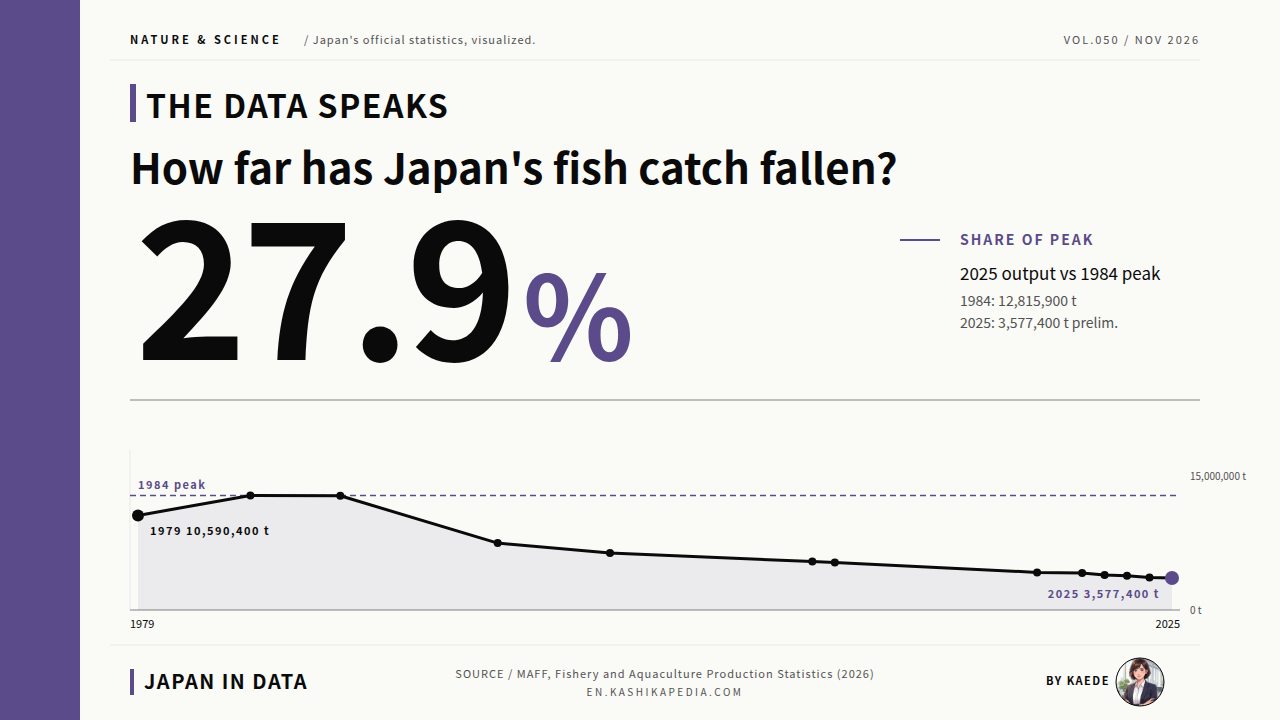
Japan’s fish catch appears in official statistics as “fishery and aquaculture production”. The Ministry of Agriculture, Forestry and Fisheries (MAFF) puts the 2025 figure at 3,577,400 tonnes (preliminary), 27.9% of the 1984 peak of 12,815,900 t, or a little over a quarter. This total includes farmed output as well as the wild catch at sea; the marine fishery catch alone was 2,700,500 t.
This article draws on primary sources: MAFF’s Statistical Survey on Marine Fishery Production (long-term series, final figures), its first report for 2025, and the Fisheries Agency’s White Paper on Fisheries released in June 2026. It sets out the trend from 1979 to 2025 through a stacked chart, a sector comparison, a volume and value comparison and species trends, looking at how the contents of the total changed rather than only how far it fell.
In everyday terms, per-capita consumption of edible seafood was 21.3 kg in FY2024 (April 2024 to March 2025), or about 58 g a day. At the FY2001 peak of 40.2 kg, the daily figure was about 110 g, so consumption has roughly halved over the past quarter century (editorial estimate).
Japan’s fishery statistics are compiled by the Ministry of Agriculture, Forestry and Fisheries (MAFF). The headline indicator, fishery and aquaculture production, adds three parts: the marine fishery catch, the marine aquaculture (mariculture) harvest and inland (river and lake) output. Marine fishing is split into distant-water fishing, carried out far from Japan’s coast or in other countries’ waters, offshore fishing and coastal fishing. Each year’s figures appear first as a preliminary report and later as final figures. Production is counted by calendar year; consumption and self-sufficiency by the April to March fiscal year. Tonnes are metric.
How far has Japan’s fish production fallen in 40 years?
To a little over a quarter of its peak, and its makeup has changed.
Figures are current as of the time of writing. Statistics, rules and services are subject to change, so please check the official sources for the latest information.
- How Far Has Japan’s Catch Fallen? From the 1984 Peak to 2025
- Catch and Production Are Not the Same Number
- Not Just the Total but the Mix: Distant-Water Fishing Shrinks
- Volume and Value Tell Different Stories: Aquaculture and Exports
- By Species: Saury, Salmon, Flying Squid and Sardine
- Production by Decade: The Full Annual Series
- Kaede’s Summary: A Smaller Total and a Changed Mix Are Separate Stories
- Frequently Asked Questions
- 🔍 About the Fact-Check for This Article
How Far Has Japan’s Catch Fallen? From the 1984 Peak to 2025
Rather than one line for the total, the trend is drawn as five stacked layers. Following where each band grows thinner shows, at the same time, which sector the decline in the total came from.
* Compiled and edited by the Japan in Data editorial team based on official government statistics.
Fishery and aquaculture production rose from 10,590,400 t in 1979, the earliest year in the long-term series, to a peak of 12,815,900 t in 1984. It dipped in 1985, then held between 12.46 million and 12.78 million t from 1986 to 1988. From 1989 onward, the series entered a period of decline.
The pace was uneven. Nearly 5.3 million t was lost in the seven years from 12,784,700 t in 1988 to 7,488,600 t in 1995. That drop was the steepest of the 46 years in the series. According to MAFF, the rapid fall in this period reflected withdrawal from overseas fishing grounds after other countries set up exclusive economic zones, together with worsening conditions in fishing grounds.
From 1996 the decline slowed, from 6,384,100 t in 2000 to 5,432,011 t in 2009, and from 5,312,687 t in 2010 to 4,203,664 t in 2019. The last five years show a gradual, continuing fall: 4,157,811 t in 2021, 3,916,956 t in 2022, 3,829,822 t in 2023, 3,636,167 t in 2024 and 3,577,400 t in 2025 (preliminary).
A few notes apply to the series. The distant-water, offshore and coastal split follows vessel tonnage and similar criteria up to 2006, uses estimates for 2007 to 2010 and is built up by fishery type from 2011, so it is not continuous. From 1983, part of the central Pacific purse seine fishery moved from the offshore to the distant-water sector. The 2011 figures exclude data lost in Iwate, Miyagi and Fukushima Prefectures in the Great East Japan Earthquake.
Catch and Production Are Not the Same Number
The word people often search for, “catch”, and the official indicator, “production”, cover different ground. Mixing the two can put figures off by a wide margin, so the relationship between them is set out first in a chart.
* Compiled and edited by the Japan in Data editorial team based on official government statistics.
Fishery and aquaculture production is the sum of three categories: the marine fishery catch, the marine aquaculture harvest, and inland fishery and aquaculture output. In the 2025 preliminary figures, the marine fishery accounted for 2,700,500 t (75.5% of the total), marine aquaculture for 831,900 t (23.3%) and inland waters for 45,011 t (1.3%). Each part is published rounded to the nearest 100 t.
The figure widely quoted as “Japan’s fish catch” includes the harvest of farmed fish. In this article, “production” means the total of the three categories, and “marine fishery catch” means wild-caught fish only. Figures from different sources line up only when they cover the same scope, which is worth checking whenever a number is quoted.
Not Just the Total but the Mix: Distant-Water Fishing Shrinks
With the peak year beside the latest year, not only the height of the bars but also the order and thickness of the bands have changed. The story of the total and the story of the breakdown are read separately here.
* Compiled and edited by the Japan in Data editorial team based on official government statistics.
Comparing 1984 and 2024, total production fell from 12,815,900 t to 3,636,167 t, a drop of 9,179,733 t. Distant-water fishing makes up the largest part of that decline. It produced 2.28 million t in 1984 and 289,287 t in 2024, a contraction of more than 1.99 million t. Its own high was 2,344,300 t in 1987, and the drop from there comes to 2,055,013 t.
Offshore fishing also fell sharply, from 6,955,900 t in 1984 to 1,734,943 t in 2024. Marine aquaculture went from 1,110,800 t in 1984 to 802,927 t in 2024. Its decline was smaller than in other sectors, and its share of the total has risen. Distant-water fishing’s share fell from 17.8% in 1984 to 8.0% in 2024, while aquaculture (marine and inland combined) rose from 9.4% to 22.9%.
In its white paper, the Fisheries Agency notes that changes in the marine environment and declining fish stocks have been cited in connection with recent falls in production. The factors differ by species and sea area and do not reduce to a single explanation. This section records the observation that the total shrank while the weighting of its parts shifted.
Volume and Value Tell Different Stories: Aquaculture and Exports
For the same industry in the same year, the leading part changes depending on whether output is counted by volume or by value. Two 100% bars, one above the other, show that switch in a single view.
* Compiled and edited by the Japan in Data editorial team based on official government statistics.
The production value of fisheries and aquaculture in 2024 was about ¥1.6297 trillion, down about ¥54.1 billion (about 3%) from the previous year. Aquaculture accounted for about ¥724 billion of this, or 44.4%. By volume, aquaculture (marine and inland) came to 832,058 t, 22.9% of total production of 3,636,167 t. That is a little over a fifth by volume and a little over two-fifths by value.
Trade shows the same gap between volume and value. In 2025, seafood exports totaled 640,000 t (up 42.9% from the previous year) and ¥423.1 billion (up 17.2%), a record by value. Imports were 2.08 million t (down 3.4%) and ¥2.1454 trillion (up 3.8%): the volume fell while the value rose.
On the domestic side, supply for domestic consumption in FY2024 was 6.41 million t (4.97 million t for food and 1.44 million t for non-food use), down 1.48 million t (19%) from FY2014. Self-sufficiency in edible seafood was 52% (provisional), well below the FY1964 peak of 113%. Self-sufficiency and consumption are compiled by fiscal year and production by calendar year, so comparisons require matching periods.
By Species: Saury, Salmon, Flying Squid and Sardine
Broken down by species, the total holds fish that declined alongside fish that came back. Because the scales differ by an order of magnitude, sardine sits in its own upper panel with a separate scale.
* Compiled and edited by the Japan in Data editorial team based on official government statistics.
Pacific saury (sanma) fell from 187,155 t in 1980 to 39,335 t in 2024, salmon from 99,520 t to 46,706 t, and Japanese flying squid from 331,225 t to 19,850 t. The combined catch of the three fell from 547,976 t in 2014 to 137,006 t in 2022, a quarter of its earlier level within eight years.
Japanese sardine follows a different path. After an exceptional 4,488,411 t in 1988, the catch fell to 27,601 t in 2005, then rose again to 666,403 t in 2024. Within the single phrase “declining catch”, species that remain low sit alongside species that have recovered.
Production by Decade: The Full Annual Series
The charts so far show the overall shape. For checking the figure for a specific year, the annual data from 1979 to 2025 are set out below in tabs by decade.
1979 to 1989 (tens of thousands of tonnes)
| Year | Total | Marine fishing | Mariculture | Inland |
|---|---|---|---|---|
| 1979 | 1,059.0 | 947.7 | 88.3 | 23.1 |
| 1980 | 1,112.2 | 990.9 | 99.2 | 22.1 |
| 1981 | 1,131.9 | 1,014.3 | 96.0 | 21.6 |
| 1982 | 1,138.8 | 1,023.1 | 93.8 | 21.9 |
| 1983 | 1,196.7 | 1,069.7 | 106.0 | 21.1 |
| 1984 | 1,281.6 | 1,150.1 | 111.1 | 20.4 |
| 1985 | 1,217.1 | 1,087.7 | 108.8 | 20.6 |
| 1986 | 1,273.9 | 1,134.1 | 119.8 | 20.0 |
| 1987 | 1,246.5 | 1,112.9 | 113.7 | 19.8 |
| 1988 | 1,278.5 | 1,125.9 | 132.7 | 19.8 |
| 1989 | 1,191.3 | 1,044.0 | 127.2 | 20.2 |
1990 to 1999 (tens of thousands of tonnes)
| Year | Total | Marine fishing | Mariculture | Inland |
|---|---|---|---|---|
| 1990 | 1,105.2 | 957.0 | 127.3 | 20.9 |
| 1991 | 997.8 | 851.1 | 126.2 | 20.5 |
| 1992 | 926.6 | 777.1 | 130.6 | 18.8 |
| 1993 | 870.7 | 725.6 | 127.4 | 17.7 |
| 1994 | 810.3 | 659.0 | 134.4 | 16.9 |
| 1995 | 748.9 | 600.7 | 131.5 | 16.7 |
| 1996 | 741.7 | 597.4 | 127.6 | 16.7 |
| 1997 | 741.1 | 598.5 | 127.3 | 15.3 |
| 1998 | 668.4 | 531.5 | 122.7 | 14.3 |
| 1999 | 662.6 | 523.9 | 125.3 | 13.4 |
2000 to 2019 (tens of thousands of tonnes)
| Year | Total | Marine fishing | Mariculture | Inland |
|---|---|---|---|---|
| 2000 | 638.4 | 502.2 | 123.1 | 13.2 |
| 2001 | 612.6 | 475.3 | 125.5 | 11.7 |
| 2002 | 588.0 | 443.4 | 133.3 | 11.3 |
| 2003 | 608.3 | 472.2 | 125.1 | 11.0 |
| 2004 | 577.5 | 445.5 | 121.5 | 10.5 |
| 2005 | 576.5 | 445.7 | 121.2 | 9.6 |
| 2006 | 573.5 | 447.0 | 118.3 | 8.3 |
| 2007 | 572.0 | 439.7 | 124.2 | 8.1 |
| 2008 | 559.2 | 437.3 | 114.6 | 7.3 |
| 2009 | 543.2 | 414.7 | 120.2 | 8.3 |
| 2010 | 531.3 | 412.2 | 111.1 | 7.9 |
| 2011 | 476.6 | 382.4 | 86.9 | 7.3 |
| 2012 | 485.3 | 374.7 | 104.0 | 6.7 |
| 2013 | 477.4 | 371.5 | 99.7 | 6.1 |
| 2014 | 476.6 | 371.3 | 98.8 | 6.4 |
| 2015 | 463.1 | 349.2 | 106.9 | 6.9 |
| 2016 | 436.8 | 327.3 | 103.3 | 6.3 |
| 2017 | 430.6 | 325.8 | 98.6 | 6.2 |
| 2018 | 442.7 | 336.6 | 100.5 | 5.7 |
| 2019 | 420.4 | 323.5 | 91.5 | 5.3 |
2020 to 2025 (tens of thousands of tonnes)
| Year | Total | Marine fishing | Mariculture | Inland |
|---|---|---|---|---|
| 2020 | 423.6 | 321.5 | 97.0 | 5.1 |
| 2021 | 415.8 | 317.9 | 92.7 | 5.2 |
| 2022 | 391.7 | 295.1 | 91.2 | 5.4 |
| 2023 | 383.0 | 292.6 | 85.2 | 5.2 |
| 2024 | 363.6 | 278.6 | 80.3 | 4.7 |
| 2025 prelim. | 357.7 | 270.1 | 83.2 | 4.5 |
* Compiled and edited by the Japan in Data editorial team based on official government statistics.
Total production first fell below 4 million t in 2022, at 3,916,956 t, and the marine fishery catch dropped below 3 million t in the same year, at 2,951,001 t. Marine aquaculture moved between about 0.9 million and just over 1 million t through the 2010s, but fell to 851,509 t in 2023 and 802,927 t in 2024, below 900,000 t in both of the last two years.
Inland fisheries and aquaculture shrank from 231,000 t in 1979 to 45,011 t in 2025, but the survey scope for this category has changed several times. Inland fishing covered all rivers and lakes up to 2000, 148 major rivers and 28 lakes from 2001 to 2003, and 142 major rivers and 24 lakes from 2024. Long-term comparisons of inland figures depend on taking these scope changes into account.
Kaede’s Summary: A Smaller Total and a Changed Mix Are Separate Stories
Laid over one another, the charts show that “how far it fell” and “what fell” were separate questions all along. They are set out below as three observations.
On the question of how far Japan’s fish catch has fallen, the charts in this article show that the overall level and the composition have moved separately. The scope of the indicator, the period chosen, and whether output is counted by volume or by value each change the picture. The figures are set out here as observations, without assigning them a value.
Taken together, the three observations show that the phrase “the catch has declined” holds several separate movements at once: the contraction of distant-water fishing, the rising relative weight of aquaculture, gains and losses by species, and the gap between volume and value. How far the total has shrunk and how its contents have changed are two questions with different answers. Figures on Japan’s fish catch differ in scope, period and measure, and the picture they give depends on all three.
Frequently Asked Questions
Three points go together when reading a fish catch chart: the scope of the indicator, calendar year versus fiscal year, and final versus preliminary figures. A change in any one of them changes the numbers on the page.
Q1. What Is the Difference Between “Catch” and “Production”?
The official indicator is fishery and aquaculture production, the sum of the marine fishery catch, the marine aquaculture harvest and inland fishery and aquaculture output. In the 2025 preliminary figures, total production of 3,577,400 t comprised 2,700,500 t from marine fisheries, 831,900 t from marine aquaculture and 45,011 t from inland waters. “Catch” can refer to the marine fishery alone or to total production, so comparisons hold only when the scope matches.
Q2. How Is the Decline in Production Explained?
According to MAFF, the rapid decline from around 1988 to 1995 reflected withdrawal from overseas fishing grounds after other countries set up exclusive economic zones, together with worsening conditions in fishing grounds. The Fisheries Agency’s White Paper on Fisheries notes that changes in the marine environment and declining fish stocks have been cited for recent falls. The factors differ by species and sea area, and the published materials do not narrow them to a single cause.
Q3. How Have Exports Moved as Production Fell?
In 2025, seafood exports were 640,000 t by volume (up 42.9% year on year) and ¥423.1 billion by value (up 17.2%), a record. Production in the same year was 3,577,400 t, down 1.6%. Production and exports differ in coverage and units and do not necessarily move together. The same split between volume and value appears in 2024, when aquaculture made up 44.4% of production value but 22.9% of production volume.
🔍 About the Fact-Check for This Article
Japan in Data fact-checks its articles. The evidence behind the fact-check for this page is set out below.