
Japan’s game market figures change their indicator name and their scope from year to year. Once each number is matched to its survey and its definition before being lined up, the movements of console games and smartphone games become much easier to see.
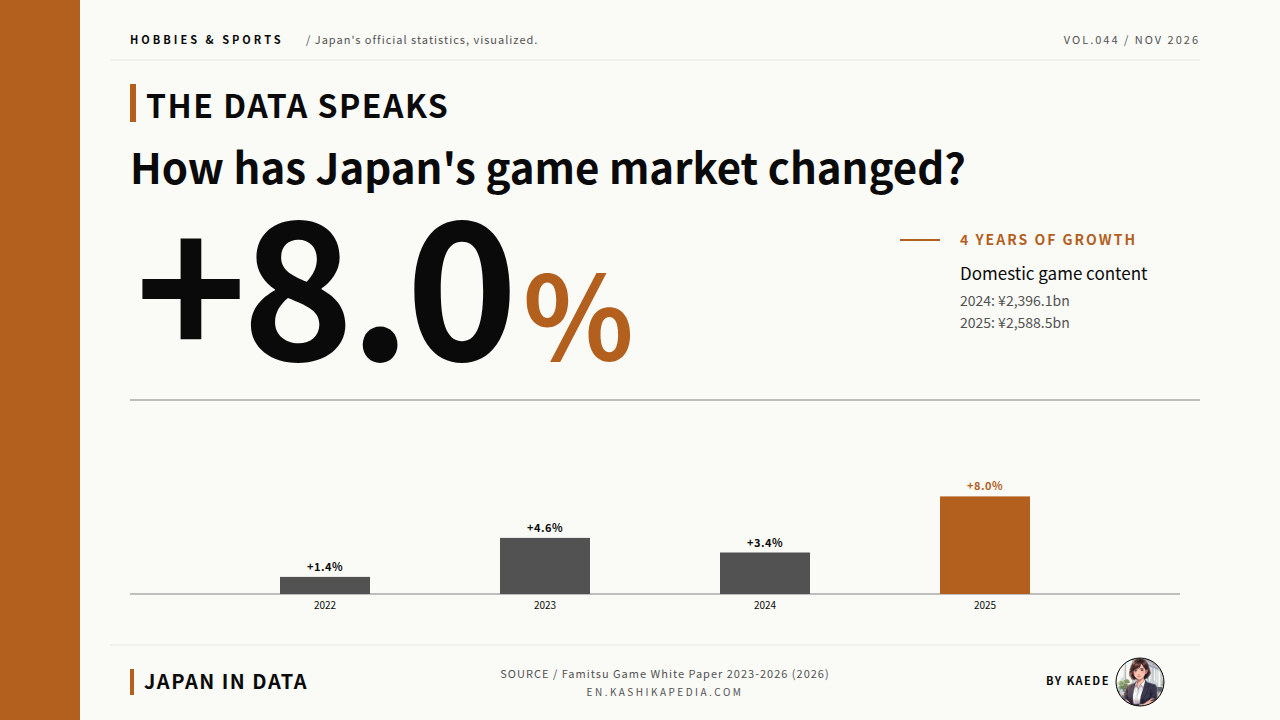
Japan’s domestic game content market reached ¥2,588.5 billion in 2025, up 8.0% on the previous year. The indicator name and the survey method, however, changed with the edition covering 2024, so the amount cannot simply be subtracted from the figures for 2023 and earlier. The only series that lines up across all four years is the annual growth rate each White Paper reported on its own basis.
This article draws on published sources: the release announcements for the Famitsu Game White Paper 2023 to 2026, the Famitsu Marketing Flash Report, and the CESA Game Industry Report 2025. It charts the annual market size, the breakdown by segment, the retail console market, game players by device and the comparison with the world. It also notes how the picture differs between yen amounts and head counts.
The figures in this article come from published industry sources: the annual Famitsu Game White Paper, compiled by Kadokawa ASCII Research Laboratories; the Famitsu Marketing Flash Report on retail sales, published by Kadokawa; and the annual report of the Computer Entertainment Supplier’s Association (CESA), Japan’s game industry body. In these sources, “console” means home game machines such as Nintendo Switch and PlayStation, and “mobile” means smartphones and tablets. Amounts are in yen, and years are calendar years unless noted.
How has Japan’s game market changed?
Japan’s domestic game content market reached ¥2,588.5 billion in 2025.
Figures are current as of the time of writing. Statistics, rules and services are subject to change, so please check the official sources for the latest information.
- How Large Is Japan’s Game Market?
- The Yen Yardstick Changed Partway Through
- Where Does 80% of the Market Sit?
- Smartphones and Consoles: Movements Inside the Segments
- How Did the Retail Console Market Move in 2025?
- How Does It Look by Number of Players?
- Where Does Japan Stand in the World?
- Kaede’s Summary: Three Observations on Japan’s Game Market
- Frequently Asked Questions
- 🔍 About the Fact-Check for This Article
How Large Is Japan’s Game Market?
First, the yen amounts year by year. The four bars cannot be read as one continuous line, though. The chart splits them into two blocks and pulls the annual growth rates out into a separate band below.
According to the Famitsu Game White Paper 2026, released by Kadokawa ASCII Research Laboratories on August 6, 2026, Japan’s domestic game content market was ¥2,588.5 billion in 2025. That was up 8.0% year on year, above the 3.5% growth the same source reports for the world market. The figure covers game software for consoles, PCs and mobile devices, plus add-on content, in-game purchases and subscriptions.
A year earlier, the Famitsu Game White Paper 2025 put the 2024 domestic game content market at ¥2,396.1 billion, up 3.4%. Earlier editions reported the domestic game market at ¥2,125.5 billion for 2023 and ¥2,031.6 billion for 2022. Four yen figures sit side by side, but the last two and the first two carry different indicator names.
* Compiled and edited by the Japan in Data editorial team based on official government statistics.
The Yen Yardstick Changed Partway Through
Checking the published figures against each other confirms the change of basis arithmetically. The annual data is collected in the tabbed table below, so it helps to move between its three panels while reading this section.
A simple calculation from ¥2,125.5 billion (2023) to ¥2,396.1 billion (2024) gives an increase of 12.7%. The Famitsu Game White Paper 2025, however, reports the 2024 value as up 3.4% year on year. Working backward, 2023 on the new basis comes to about ¥2,317.3 billion, roughly ¥190 billion away from the ¥2,125.5 billion published the year before.
The indicator name also changed, from “domestic game market” to “domestic game content market”. The release for the Famitsu Game White Paper 2025 carries a note that the survey method was changed that year, so some definitions differ from the figures published the previous year. The two numbers are measured with different yardsticks under nearly the same name.
This article therefore does not calculate differences or growth rates across the two bases. For example, subtracting ¥2,031.6 billion (2022) from ¥2,588.5 billion (2025) and stating that the market grew by ¥556.9 billion in three years does not hold, as the method of measurement changed partway through. What can be lined up are the growth rates each White Paper reported within its own basis.
| Year | Indicator (as published) | Amount | YoY | Edition |
|---|---|---|---|---|
| 2022 | Domestic game market | ¥2,031.6bn | +1.4% | White Paper 2023 |
| 2023 | Domestic game market | ¥2,125.5bn | +4.6% | White Paper 2024 |
| 2024 | Domestic game content market | ¥2,396.1bn | +3.4% | White Paper 2025 |
| 2025 | Domestic game content market | ¥2,588.5bn | +8.0% | White Paper 2026 |
2022 and 2023 use the “domestic game market” indicator, and 2024 and 2025 use the “domestic game content market” indicator, with different definitions. Yen amounts cannot be subtracted across the two bases.
| Segment | Amount | YoY |
|---|---|---|
| Console hardware | ¥209.8bn | +3.4% |
| Console software | ¥389.3bn | +5.9% |
| Online platforms | ¥1,656.8bn | +0.9% |
| of which game apps | ¥1,243.3bn | -4.4% |
| of which PC games | ¥189.2bn | +43.2% |
| of which online for consoles (our calculation) | ¥224.3bn | Not published |
| Domestic game market (published total) | ¥2,031.6bn | +1.4% |
Console hardware means the game machines themselves, console software means game content running on consoles, and online platforms covers network-based play on smartphones, tablets, PCs and similar devices. Under a note in the source, the online market for consoles is included in “console software” in the breakdown chart only.
| Year | Total | Mobile | Console | PC |
|---|---|---|---|---|
| 2023 | 55.53 million | Not published | 29.71 million | Not published |
| 2024 | 54.75 million | 42.78 million | 29.51 million | 14.52 million |
| 2025 | 56.393 million | Not published | Not published | Not published |
The Famitsu Game White Paper 2025 notes that its survey method changed that year, so some definitions differ from the previous year’s figures. Player counts for 2023 and earlier cannot be compared directly with 2024 onward. For 2025, the total rose 3.0% year on year; console and PC players were reported slightly above the previous year and mobile players below it.
* Compiled and edited by the Japan in Data editorial team based on official government statistics.
Where Does 80% of the Market Sit?
The latest year with a complete breakdown by value is 2022. Laid out as an addition, the segment amounts show their gap from the published total directly, without any further calculation needed.
According to the Famitsu Game White Paper 2023, the 2022 breakdown was ¥209.8 billion for console hardware, ¥389.3 billion for console software and ¥1,656.8 billion for online platforms. Within online platforms, game apps accounted for ¥1,243.3 billion and PC games for ¥189.2 billion. The ¥1,656.8 billion equals 81.6% of the published total of ¥2,031.6 billion. By value, 80% of the market sits in segments built around network play.
The segment names need care. Online platforms cover PCs as well as smartphones and tablets. The smartphone and tablet portion corresponds to game apps at ¥1,243.3 billion, so the ¥1,656.8 billion total cannot be read on its own as a “smartphone market” in the way the label might suggest.
Adding the three segments gives ¥2,255.9 billion, which exceeds the published total of ¥2,031.6 billion by ¥224.3 billion. According to a note in the source, the online market for consoles is included on the console software side in the breakdown chart only, to show the full size of console gaming. Subtracting game apps and PC games from the ¥1,656.8 billion for online platforms leaves ¥224.3 billion, matching that portion.
* Compiled and edited by the Japan in Data editorial team based on official government statistics.
Smartphones and Consoles: Movements Inside the Segments
Inside the segment that holds 80% of the market, some parts are growing and others are flat. Joining the two years with lines makes that difference clear at a glance.
According to the Famitsu Game White Paper 2024, the online platform market was ¥1,721.6 billion in 2023, or 81.0% of the published total of ¥2,125.5 billion. Game apps within it came to ¥1,235.1 billion, down 0.7% year on year. The decline was smaller than the previous year’s. Even so, 2023 was the third straight year in which the game app market fell below the year before.
The same source reports that the PC game market grew 24.9% year on year. The 2023 yen amount for PC games was not published, however; only the growth rate was given. This article does not estimate unpublished amounts or place any such estimate on its charts.
The release for the Famitsu Game White Paper 2024 also gives two different values for domestic game apps within the same document: ¥1,232.1 billion in its opening summary and ¥1,235.1 billion in the body text describing the breakdown, a gap of ¥3 billion. This article uses the body text figure of ¥1,235.1 billion, which sets out the breakdown in detail.
* Compiled and edited by the Japan in Data editorial team based on official government statistics.
How Did the Retail Console Market Move in 2025?
Console games also have a flash estimate of retail sales, separate from the White Paper. Because the scope differs, this series is kept apart from the White Paper amounts and read on its own here.
According to the Famitsu Marketing Flash Report published by Kadokawa on January 19, 2026, Japan’s domestic console game market was ¥418.13 billion in 2025: ¥282.69 billion for hardware and ¥135.44 billion for packaged software. In 2024 it was ¥301.32 billion (hardware ¥189.40 billion, packaged software ¥111.92 billion). The report puts the total at 138.8% of the previous year, hardware at 149.3% and software at 121.0%.
This series covers store and mail-order sales and excludes digital payments such as download sales, add-on content and in-game purchases. Its scope differs from the White Paper market size. Even for the same year, 2025, the ¥418.13 billion cannot be read as one part of the ¥2,588.5 billion and subtracted from it.
The counting periods also differ. The 2025 figure covers 52 weeks from December 30, 2024 to December 28, 2025, and the 2024 figure covers 52 weeks from January 1 to December 29, 2024. The 2023 figure was compiled over 53 weeks, and the market size for that year was ¥403.88 billion.
By hardware unit sales, the report lists Nintendo Switch 2, released in June 2025, at 3.784 million units by the end of the year, the original Nintendo Switch at 1.520 million and PlayStation 5 at 879,000. Among packaged software, Mario Kart World ranked first for the year at 2.668 million copies.
* Compiled and edited by the Japan in Data editorial team based on official government statistics.
How Does It Look by Number of Players?
Shares by value and shares by number of players are separate questions. Lining up players by device reveals one feature of the data: the device figures add up to more than the total.
According to the CESA Game Industry Report 2025, published by the Computer Entertainment Supplier’s Association on December 15, 2025, Japan had 54.75 million game players in 2024. By platform, mobile games had 42.78 million players (down 1.8% year on year), PC games 14.52 million (up 0.5%) and console games 29.51 million (down 0.7%).
Adding the three gives 86.81 million, which is 32.06 million more than the total of 54.75 million. Because the same person can be counted on more than one device, the device figures do not add back up to the total. The Famitsu Game White Paper 2025 also reports 24.782 million people who play on two or more of console, PC and mobile.
By value, 80% of spending goes through online channels (2023), while by head count there are 42.78 million mobile players and 29.51 million console players (both 2024). Shares by value and shares by users do not fall in the same order. The 2025 total was 56.393 million game players, an increase of 1.640 million on the previous year, according to the published figures.
* Compiled and edited by the Japan in Data editorial team based on official government statistics.
Where Does Japan Stand in the World?
Finally, the domestic market next to the world market. The world amount is converted into yen, so keeping the exchange rate assumptions in view helps avoid misreading the comparison.
According to the Famitsu Game White Paper 2026, the world game content market was ¥32,102.4 billion (US$214.56 billion) in 2025, up 3.5% year on year, or up 5.0% on a same-currency basis. The yen conversion uses the period-average exchange rate: US$1 equaled ¥149.62 in 2025 and ¥151.69 in 2024.
Dividing the domestic ¥2,588.5 billion by the world’s ¥32,102.4 billion gives 8.1%. By value, Japan accounts for roughly one-twelfth of the world game content market. By category, world growth was 8.0% for console games, 5.8% for PC games and 1.3% for mobile games, with all three above the previous year.
Per player, the picture shifts. Dividing the 2025 domestic market of ¥2,588.5 billion by the 56.393 million game players that year gives about ¥45,900 per person per year, or about ¥3,800 per month. These are simple averages across all players, calculated by the editorial team from the published figures.
* Compiled and edited by the Japan in Data editorial team based on official government statistics.
Kaede’s Summary: Three Observations on Japan’s Game Market
Even under the same words, “game market”, different sources measure different scopes. To close, the figures set out in this article are gathered here as three observed facts.
The figures were laid out from five angles: market size, breakdown, the retail market, player numbers and the comparison with the world. All are published values, but their scope and reference years are not uniform. Rather than ranking the numbers, the summary below keeps each one alongside what it measures and lists them as observed facts.
Read together, the three observations show that the answer to how Japan’s game market has changed takes a different shape depending on which source, which definition and which range of years is used. Segments where spending is growing and segments where player numbers are falling exist at the same time, and the published figures show both.
Frequently Asked Questions
When looking up game market figures, it helps to check three things together: the indicator name, the scope of what is counted and the reference year. A change in any one of them changes the amount, even under the same label of “market size”.
Q1. Why do the sources for Japan’s game market size differ by year?
From its 2025 edition, the Famitsu Game White Paper renamed its indicator from “domestic game market” to “domestic game content market” and revised its survey method. The values for 2022 and 2023 and those for 2024 and 2025 therefore follow different definitions, and the amounts cannot be subtracted directly. This article presents them separately by basis, and the tabbed table of annual data notes which basis each value follows.
Q2. Are “online platforms” the same as smartphone games?
Online platforms are a segment that covers PCs as well as smartphones and tablets. Of the ¥1,656.8 billion in 2022, game apps for smartphones and tablets accounted for ¥1,243.3 billion and PC games for ¥189.2 billion. According to a note in the source, the remaining ¥224.3 billion corresponds to the online market for game consoles.
Q3. Why does the article show two different console market sizes?
The two series have different scopes. The Famitsu Game White Paper’s annual estimate includes downloads and in-game spending, while the retail figures in the Famitsu Marketing Flash Report exclude download sales, add-on content and in-game purchases. Retail sales in 2025 were ¥418.13 billion, a separate series from the White Paper’s domestic game content market of ¥2,588.5 billion.
🔍 About the Fact-Check for This Article
Japan in Data fact-checks its articles. The evidence for the fact-check on this page is listed below.