
The quickest way to see how a ranking has moved is to put the score line and the rank labels in the same chart. Set out across nine rounds, the scores stay in roughly the same band while the ranks move up and down.
In PISA 2025, released on September 8, 2026, Japan ranked 1st of the 38 OECD member countries in all three subjects: science, reading and mathematics. It is the first such result since the survey began in 2000. Among all 91 participating countries and economies, Japan placed 5th in science, 4th in reading and 5th in mathematics, behind B-S-J-Z (Beijing, Shanghai, Jiangsu and Zhejiang, China), Singapore, Macao and Chinese Taipei (Taiwan).
PISA is an OECD survey that measures how far 15-year-old students (in Japan, first-year upper secondary students) can apply their knowledge and skills to real-life tasks. Using Key Points of PISA 2025, published by Japan’s education ministry and its research institute, and the OECD results report as primary sources, this article follows the ranking through the numbers alone: a world map, nine rounds of scores and ranks, two ways of ranking, the size of the pool and the share of low performers.
PISA (Programme for International Student Assessment) is run by the OECD (Organisation for Economic Co-operation and Development), which has 38 member countries. It tests reading, mathematics and science, and nine rounds have been held from 2000 to 2025. Japan’s results are published by the Ministry of Education, Culture, Sports, Science and Technology (MEXT) and the National Institute for Educational Policy Research (NIER). Ranks are reported among OECD members and among all participating countries and economies. A rank range is the span of ranks a score could hold, given sampling error.
How has Japan’s PISA ranking moved?
In reading, from 11th to 1st among OECD members. The score changed by 1 point; the scores around it moved.
Score gap: 1 point (504 vs 503; 10 places apart)
Figures are current as of the time of writing. Statistics, rules and services are subject to change, so please check the official sources for the latest information.
- Where Japan Stands in 2025: 1st in the OECD, 5th Overall
- Science Scores on a World Map: From 597 at the Top to 317
- Scores Held, Ranks Moved: Reading From 504 and 11th to 503 and 1st
- Two Ways to Count a Rank: Within the OECD, Across All Participants
- Inside the No. 1 Rank, More Low Performers: Reading 13.8% to 18.6%
- Family Background and Scores: Bottom Quarter 504 vs OECD Average 482
- All Nine Rounds in One Table: Scores, Two Ranks and OECD Averages
- Kaede’s Summary: Ranks Moved, Scores Held, Low Performers Grew
- Frequently Asked Questions
- 🔍 About the Fact-Check for This Article
Where Japan Stands in 2025: 1st in the OECD, 5th Overall
A rank is easy to misread unless it says what it is a rank among. With the top 10 in each subject set out as horizontal bars, and OECD members and non-members in different colours, Japan’s position under both counts is visible at once.
* Compiled and edited by the Japan in Data editorial team based on official government statistics.
Japan’s mean scores in PISA 2025 were 538 in science, 503 in reading and 525 in mathematics. It ranked 1st of 38 OECD members in all three, ahead of the OECD averages (science 482, reading 461, mathematics 463) by 56, 42 and 62 points. It is the first time since the survey began in 2000 that Japan has ranked 1st among OECD members in all three subjects.
Among all 91 participating countries and economies, Japan placed 5th in science, 4th in reading and 5th in mathematics. Those above it are B-S-J-Z, Singapore, Macao and Chinese Taipei, none of them OECD members. In mathematics, all four scored 546 or higher, at least 21 points above Japan’s 525.
Each rank also comes with a statistical margin. According to the OECD analysis, the science scores of 3rd-placed Macao (541), 4th-placed Chinese Taipei (540) and 5th-placed Japan (538) are not significantly different. MEXT’s materials likewise give Japan’s 2025 rank ranges among OECD members as 1st to 3rd in science, 1st to 8th in reading and 1st to 2nd in mathematics.
Science Scores on a World Map: From 597 at the Top to 317
For 91 participants, a map shows where high-scoring countries cluster faster than a table does. Participating regions that do not match national borders are left unshaded and listed in the notes.
* Compiled and edited by the Japan in Data editorial team based on official government statistics.
The highest science score belongs to B-S-J-Z at 597, followed by Singapore at 560. The lowest, Rwanda, scored 317, a gap of 280 points from the top. The OECD average was 482, and Japan’s 538 is 56 points above it.
Countries scoring 500 or more, shaded darkest on the map, are concentrated in East Asia, Oceania, Northern Europe and North America. Much of Europe falls in the 450 to 499 band, while participants in Latin America, the Middle East and Africa are mostly in the 400s and 300s. Japan’s 538 is the highest score among the countries that can be shaded on the map.
Of the 91 participants, B-S-J-Z, Macao, Hong Kong, Chinese Taipei, Ukraine (17 regions), Kurdistan (Iraq) and Dushanbe (Tajikistan) do not match national borders, so they are listed in the notes rather than shaded. Countries too small to display at this scale, such as Singapore and Malta, are treated the same way.
Scores Held, Ranks Moved: Reading From 504 and 11th to 503 and 1st
This is the central chart of the article. Each subject has its own panel with Japan’s score line and the OECD average, and each point carries its rank and the number of countries compared. The ranks move even where the score line stays flat.
* Compiled and edited by the Japan in Data editorial team based on official government statistics.
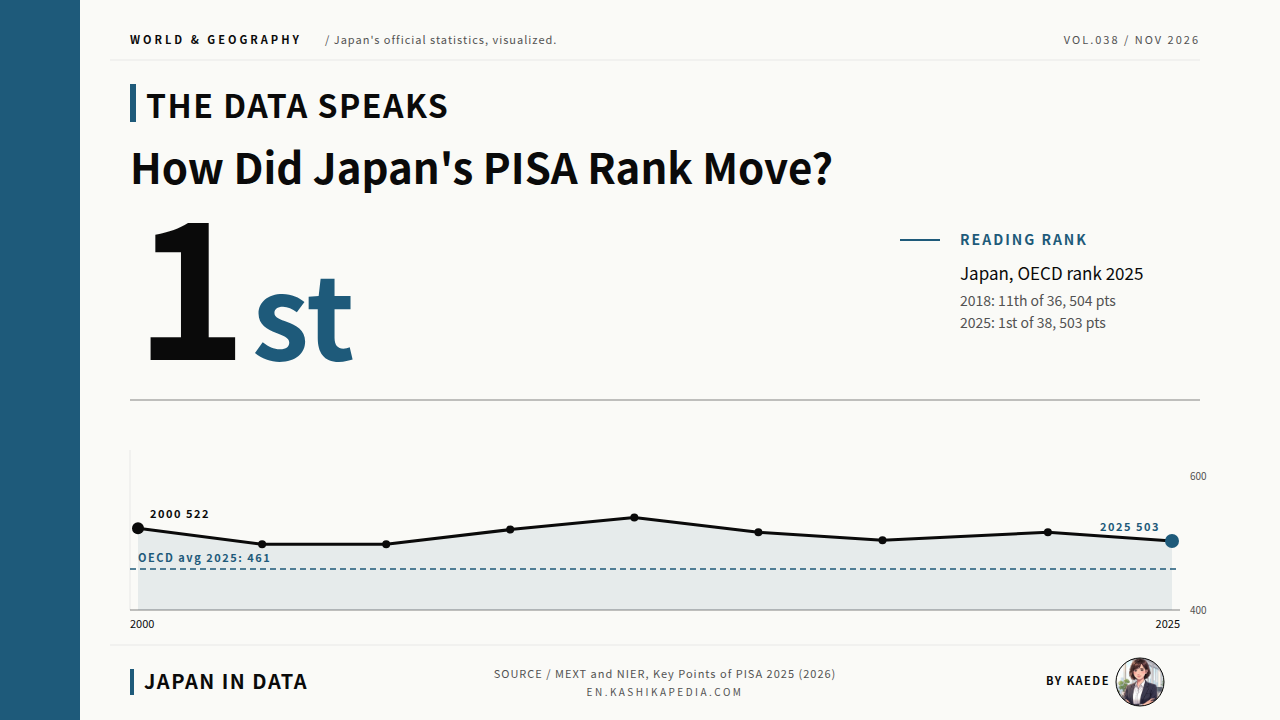
Japan’s reading score was 504 in 2018 and 503 in 2025, a difference of 1 point. Its rank among OECD members, however, moved from 11th (of 36) in 2018 to 1st (of 38) in 2025. Over the same period, the OECD average fell 26 points, from 487 to 461, while Japan’s score moved by 1 point and its rank by 10 places.
The gap between Japan and the OECD average was 17 points in 2018 and 42 points in 2025. A rank is a position relative to other countries, so it can change when other scores move even if Japan’s own score barely changes. According to MEXT, the OECD average has declined since 2015, while Japan’s scores in all three subjects show no significant trend and are described as flat.
Across nine rounds, Japan’s reading score ranged from 498 (2003 and 2006) to 538 (2012), mathematics from 523 to 536, and science from 529 to 547. Ranks ranged from 12th to 1st in reading, 6th to 1st in mathematics and 3rd to 1st in science. From 2022 to 2025, reading fell significantly from 516 to 503; the declines in mathematics and science were not significant.
The vertical marker in the chart shows the 2015 switch from paper-based to computer-based testing. Scores for mathematics and science in 2000, and for science in 2003, are not comparable over time, as each subject’s scale is anchored to the round in which it was first the main domain. These appear as hollow points and are not joined to the line.
Two Ways to Count a Rank: Within the OECD, Across All Participants
Overlaying the rank among OECD members and the rank among all participants shows the gap between the two lines changing from round to round. The size of each pool follows as a bar chart.
* Compiled and edited by the Japan in Data editorial team based on official government statistics.
Take reading in 2018: Japan was 11th of 36 OECD members and 15th of 79 participating countries and economies. In 2025 it was 1st of 38 OECD members and 4th of 91 overall. The difference between the two ranks equals the number of non-OECD participants placed above Japan.
In mathematics, Japan has ranked 1st among OECD members in four consecutive rounds since 2015, while its overall rank has stayed at 5th or 6th. The top places go to B-S-J-Z, Singapore, Macao, Chinese Taipei and Hong Kong; in 2025, four of these five ranked above Japan. Science shows the same pattern, with 1st among OECD members and 5th overall in 2025.
* Compiled and edited by the Japan in Data editorial team based on official government statistics.
The pools have also changed. The number of participating countries and economies grew from 32 in 2000 to 91 in 2025, and the number of OECD countries compared grew from 28 to 38. When ranks are compared across years, the denominator differs by a factor of nearly three.
In 2003, Japan ranked 12th of 30 OECD members in reading (8th of 28 in the previous round) and 4th in mathematics (previously 1st), and the drop was called the “PISA shock” at the time. This article records only that the term was used, and follows the movement of scores and ranks. Japan’s reading score of 498 in 2003 is 5 points below its 503 in 2025.
Inside the No. 1 Rank, More Low Performers: Reading 13.8% to 18.6%
Mean scores and ranks alone do not show how students are distributed. Setting the share at proficiency Level 1 or below beside the share at Level 5 or above, from 2000 onward, brings out the movement behind the average.
* Compiled and edited by the Japan in Data editorial team based on official government statistics.
In the 2025 survey, the share of low performers (Level 1 or below) rose significantly from 2022 in all three subjects: reading from 13.8% to 18.6%, mathematics from 12.0% to 16.1% and science from 8.0% to 11.3%. The share of top performers (Level 5 or above) went from 12.3% to 11.2% in reading, 23.0% to 22.3% in mathematics and 18.0% to 17.2% in science, with no significant change in any of them.
Japan’s share of low performers in reading across the rounds was 10.1% (2000), 19.0% (2003), 18.4% (2006), 13.6% (2009), 9.8% (2012), 12.9% (2015), 16.8% (2018), 13.8% (2022) and 18.6% (2025). The 2025 figure of 18.6% is the second highest of the nine rounds, after 19.0% in 2003. The OECD average share rose from 17.9% to 31.0%.
The spread of scores has also widened. In reading, the gap between the 90th and 10th percentiles grew significantly from 249 points in 2022 to 272 in 2025. The 90th percentile score moved from 636 to 631, not a significant change, while the 10th percentile fell significantly from 387 to 360. A 1st-place rank and a rise in low performers appear in the same survey.
Family Background and Scores: Bottom Quarter 504 vs OECD Average 482
This section pauses the charts and sets numbers side by side. Science scores by economic, social and cultural status (ESCS) show a gap of a different size in Japan and across the OECD.
PISA builds an index of economic, social and cultural status (ESCS) from students’ answers about their parents’ education and household possessions, and divides students into four groups. In 2025 science, Japan’s bottom quarter averaged 504 points and its top quarter 575, a gap of 71 points. Across the OECD, the averages were 446 and 531, a gap of 85 points.
In Japan, ESCS accounts for 7.6% of the variation in science scores, below the OECD average of 11.6%. Japan’s bottom-quarter score of 504 is higher than the overall OECD average of 482. This section places the figures side by side and does not address causes or draw conclusions about them.
All Nine Rounds in One Table: Scores, Two Ranks and OECD Averages
The figures from the charts are collected here in one table per subject. Switching tabs shows Japan’s score, rank among OECD members, rank range, rank among all participants and the OECD average for each of the nine rounds.
Reading (comparable from 2000). The rank range is the span of ranks a score could statistically hold. The OECD average is the mean of all OECD participants each year.
| Year | Japan’s score | Rank among OECD members | Rank range | Among all participants | OECD average |
|---|---|---|---|---|---|
| 2000 | 522 | 8th (of 28) | 2-15 | 8th | 500 |
| 2003 | 498 | 12th (of 30) | 10-18 | 14th | 494 |
| 2006 | 498 | 12th (of 30) | 9-16 | 15th | 492 |
| 2009 | 520 | 5th (of 34) | 3-6 | 8th | 493 |
| 2012 | 538 | 1st (of 34) | 1-2 | 4th | 496 |
| 2015 | 516 | 6th (of 35) | 3-8 | 8th | 493 |
| 2018 | 504 | 11th (of 36) | 7-15 | 15th | 487 |
| 2022 | 516 | 2nd (of 37) | 1-6 | 3rd | 476 |
| 2025 | 503 | 1st (of 38) | 1-8 | 4th | 461 |
Mathematics (comparable from 2003). The 2000 row is a reference value and is not comparable over time.
| Year | Japan’s score | Rank among OECD members | Rank range | Among all participants | OECD average |
|---|---|---|---|---|---|
| 2000 ref. | 557 | 1st (of 28) | n/a | 1st | n/a |
| 2003 | 534 | 4th (of 30) | 2-7 | 6th | 500 |
| 2006 | 523 | 6th (of 30) | 4-9 | 10th | 498 |
| 2009 | 529 | 4th (of 34) | 3-6 | 9th | 496 |
| 2012 | 536 | 2nd (of 34) | 2-3 | 7th | 494 |
| 2015 | 532 | 1st (of 35) | 1 | 5th | 490 |
| 2018 | 527 | 1st (of 37) | 1-3 | 6th | 489 |
| 2022 | 536 | 1st (of 37) | 1-2 | 5th | 472 |
| 2025 | 525 | 1st (of 38) | 1-2 | 5th | 463 |
Science (comparable from 2006; called scientific literacy until 2022). The 2000 and 2003 rows are reference values and are not comparable over time.
| Year | Japan’s score | Rank among OECD members | Rank range | Among all participants | OECD average |
|---|---|---|---|---|---|
| 2000 ref. | 550 | 2nd (of 28) | n/a | 2nd | n/a |
| 2003 ref. | 548 | 2nd (of 30) | n/a | 2nd | n/a |
| 2006 | 531 | 3rd (of 30) | 2-5 | 6th | 500 |
| 2009 | 539 | 2nd (of 34) | 2-3 | 5th | 501 |
| 2012 | 547 | 1st (of 34) | 1-3 | 4th | 501 |
| 2015 | 538 | 1st (of 35) | 1-2 | 2nd | 493 |
| 2018 | 529 | 2nd (of 37) | 1-3 | 5th | 489 |
| 2022 | 547 | 1st (of 37) | 1 | 2nd | 485 |
| 2025 | 538 | 1st (of 38) | 1-3 | 5th | 482 |
* Compiled and edited by the Japan in Data editorial team based on official government statistics.
The table lists the rank among OECD members and the rank among all participants in separate columns. As PISA is a sample survey, the rank range shows the span of ranks a score could statistically hold. Reading in 2025 is ranked 1st, with a rank range of 1st to 8th and a score confidence interval of 495 to 510.
Other international rankings raise the same questions about how a rank is counted and how large the pool is. Another Japan in Data article on an international ranking, how Japan’s passport ranking has moved over 20 years, reads its figures with the same attention to counting methods and denominators.
Kaede’s Summary: Ranks Moved, Scores Held, Low Performers Grew
With the world map and the trends laid out together, the answer to how the ranking has moved can be set out as the movement of three figures.
To the question of how Japan’s PISA ranking has moved, the charts in this article have presented four figures separately: rank, score, OECD average and pool size. Any one of them on its own tells a different story. Rather than attach a judgement to the numbers, the summary below sets out what moved and what did not, as observed facts.
Read together, the three observations place the 2025 first place in all three subjects beside a Japanese score that barely changed, lower scores elsewhere and a shift in Japan’s relative position within a larger pool. The rank moved, the score barely moved and the share of low performers grew, all within the same survey. The answer to how the rank has moved depends on which pool it is counted in and which year it is compared with.
Frequently Asked Questions
A PISA rank reads differently depending on three things: the size of the pool, the score gap and the distribution. The same number can tell a different story when any one of these three changes.
Q1. Where Does Japan Rank in PISA?
There are two ways to count. In the 2025 survey, Japan ranked 1st of 38 OECD members in all three subjects: science, reading and mathematics. Among all 91 participating countries and economies, including non-OECD members, it was 5th in science, 4th in reading and 5th in mathematics, with B-S-J-Z, Singapore, Macao and Chinese Taipei above it.
Q2. Did Japan’s Reading Rank Rise From 11th to 1st Because Its Score Went Up?
Japan’s score was 504 in 2018 and 503 in 2025, a difference of 1 point. Over the same period, the OECD average fell from 487 to 461. A rank is a position relative to other countries, so it can change when other scores move even if Japan’s own score barely changes. Japan’s 2025 reading rank range is 1st to 8th, and statistically its position lies within that span.
Q3. Are There Any Concerns Despite the 1st-Place Ranking?
In the 2025 survey, the share of students at Level 1 or below rose significantly from the previous round in all three subjects; in reading, from 13.8% to 18.6%. The share at Level 5 or above showed no significant change. The materials published by MEXT and NIER identify the rise in the share of low performers as an issue.
🔍 About the Fact-Check for This Article
Japan in Data fact-checks its articles. The evidence for the fact-check on this page is set out below.