
“Average income” and “middle income” share the word income, yet the two can differ widely. Drawing the actual income distribution as a histogram, with one line for the mean and one for the median laid over it, shows at a glance why the two figures sit apart.
Headline figures for “average annual income” in Japan often sit apart from how people describe their own finances. According to the Ministry of Health, Labour and Welfare (MHLW) and its 2024 Comprehensive Survey of Living Conditions, mean income per household in 2023 was ¥5,360,000. The median, the household exactly in the middle when all are ranked by income, was ¥4,100,000, a gap of ¥1,260,000.
The gap reflects the shape of the income distribution. Household income clusters at the lower end and trails off in a long tail toward higher incomes, a pattern known as right-skewed. In such a distribution, a small number of high values raise the mean. In the 2023 data, 61.9% of households fall below the mean, and the “average household” does not describe the majority.
This article works from primary sources, chiefly the Comprehensive Survey of Living Conditions and the National Tax Agency’s Statistical Survey of Actual Status for Salary in the Private Sector. A histogram of household income, an income curve by age and several other charts set out why the mean and the median diverge. The final section separates household income from individual pay, two figures that are often confused.
Japan’s household income figures come from the Comprehensive Survey of Living Conditions, run by the Ministry of Health, Labour and Welfare (MHLW). Each survey reports income for the previous calendar year, so the 2024 survey covers income earned in 2023. Household income here is the combined income of all members, including earnings, pensions and property income. Individual pay figures come from a separate survey by the National Tax Agency, which covers private-sector employees, including part-time workers, and counts salary and bonuses only.
How far apart are Japan’s average and middle household incomes?
In 2023, household income averaged ¥5,360,000, while the middle household had ¥4,100,000. The gap is ¥1,260,000.
Gap between mean and median: ¥1.26 million
Figures are current as of the time of writing. Statistics, rules and services are subject to change, so please check the official sources for the latest information.
- Mean vs. Median: Start With the Shape of Household Income
- Why the Distribution Leans Right: 61.9% of Households Are Below the Mean
- Why Both the Mean and the Median Are Correct
- How the Gap Between Mean and Median Has Moved in Recent Surveys
- How Household Income Changes With the Age of the Household Head
- Household Income vs. Individual Pay: Two Different Measures
- Kaede’s Summary: Why the Mean and the Median Differ
- Frequently Asked Questions
- 🔍 About the Fact-Check for This Article
Mean vs. Median: Start With the Shape of Household Income
A histogram shows where household incomes pile up far more clearly than a table does. With two lines added, one for the mean and one for the median, the distance between them becomes visible in a single view.
* Compiled and edited by the Japan in Data editorial team based on official government statistics.
The mean and the median both aim to describe a typical value, but they are calculated differently. The mean adds up the income of every household and divides the total by the number of households. The median ranks all households from the lowest income to the highest and takes the value of the household exactly in the middle.
The chart plots the share of households in each income class (the relative frequency) exactly as published in the 2024 survey. Households are most concentrated between ¥1 and ¥3 million, and the distribution trails off in a long tail toward higher incomes. In a symmetrical distribution the mean and the median coincide; in one with a long right tail, they separate.
For 2023, mean household income was ¥5,360,000 and the median ¥4,100,000, a difference of ¥1,260,000. On the chart, the median line sits near the peak of the distribution, while the mean line lies further to the right, on the higher side. The figures indicate that a small number of high-income households pull the mean to the right, opening a gap between the two.
Why the Distribution Leans Right: 61.9% of Households Are Below the Mean
Splitting all households into one band, below the mean on one side and above it on the other, shows which side holds the majority. The dividing line is the mean itself, ¥5.36 million.
* Compiled and edited by the Japan in Data editorial team based on official government statistics.
By income class, the most common classes are ¥1 to under ¥2 million and ¥2 to under ¥3 million (100 to 200 and 200 to 300 in man, the ten-thousand-yen unit used in Japanese statistics), each holding 14.4% of households. The ¥3 to under ¥4 million class follows at 13.1%. Most households, in other words, sit in income classes below the mean of ¥5.36 million.
Dividing the distribution at the mean, 61.9% of households fall below the mean income and 38.1% are above it. With more than six in ten households on the lower side, the “average household” does not describe the majority. A focus on the mean alone makes it harder to see that most of the distribution lies below that single point.
A majority below the mean is not specific to Japan. It arises mathematically in any distribution with a long right tail. Income has a floor of ¥0 but a wide-open upper end, so a few large values raise the mean, and more households end up below it than above it.
Why Both the Mean and the Median Are Correct
Claims that “the average is misleading” or that “only the median is real” appear often. I do not rank one above the other. A small example shows how their roles differ.
* Compiled and edited by the Japan in Data editorial team based on official government statistics.
Take five households. Measured in man, the ten-thousand-yen unit used in Japanese statistics, four earn 300, 350, 400 and 450, and the fifth earns ¥20 million. The mean is ¥7 million, a level lifted by the single ¥20 million household. The median of the same five households stays at the middle value of ¥4 million, and adding the high-income household does not move it.
As the example shows, the mean is sensitive to outliers, while the median is robust to them. The question is not which one is right, but which one fits the purpose. The mean describes the center of gravity of income across society; the median sits closer to the experience of the household exactly in the middle.
A sense that “average income looks too high” does not indicate that the mean is wrong. High-income households lift the mean, and in a distribution with a long right tail, many people finding themselves below it is the expected pattern. The two measures describe the same data from different angles.
How the Gap Between Mean and Median Has Moved in Recent Surveys
Two lines side by side, one for the mean and one for the median, show whether the gap between them has narrowed or held steady in the most recent surveys.
* Compiled and edited by the Japan in Data editorial team based on official government statistics.
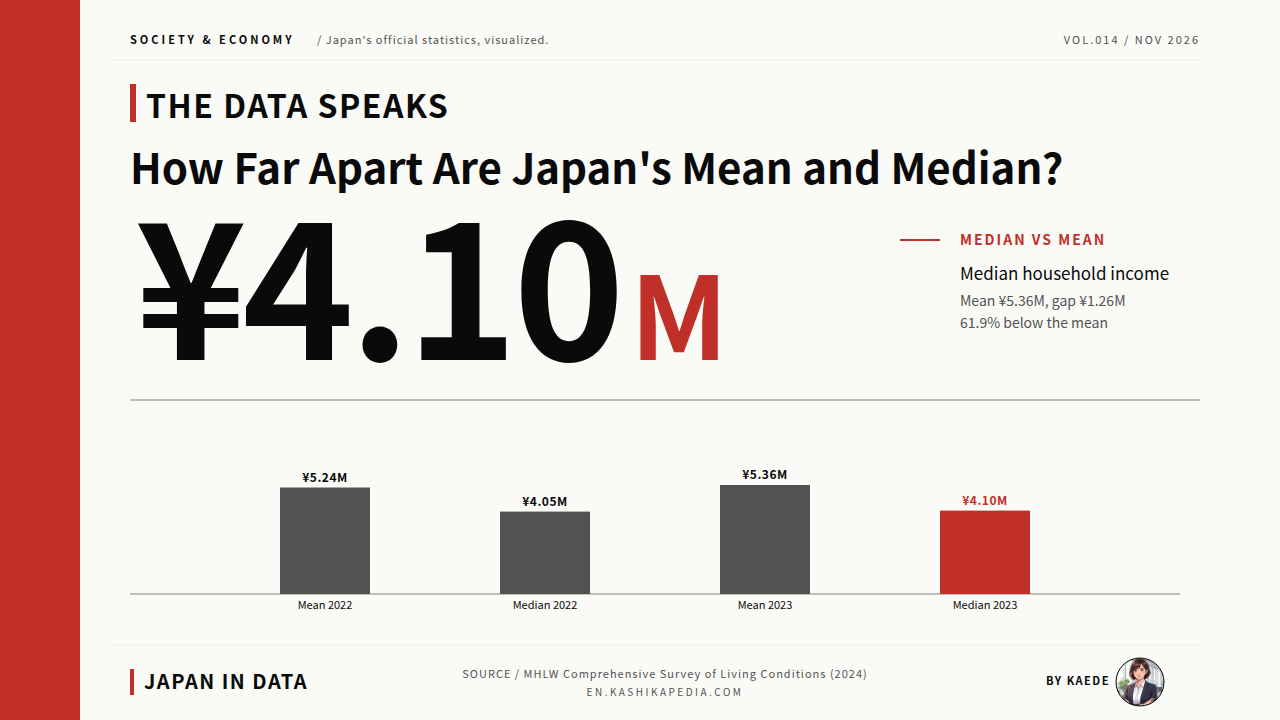
The two most recent surveys publish both an official mean and an official median. For 2022 income, the mean was ¥5.24 million and the median ¥4.05 million. For 2023 income, reported in the 2024 survey, the mean was ¥5,360,000 and the median ¥4,100,000. The mean turned upward between 2022 and 2023, and the median also edged up.
The gap between the mean and the median (about ¥1.26 million) has stayed at a broadly similar width in recent years. With both measures moving together, the figures indicate that the right-skewed shape of the distribution has not changed much in the short term. The median here is a household median, not the individual median often cited for personal income.
The Comprehensive Survey of Living Conditions combines a large-scale survey every three years with smaller surveys in the years between. In some years, prefectures hit by disasters are excluded, and in others, such as 2019, the survey was not carried out. Long time series therefore come with year-specific notes. This chart covers only the two latest surveys with an officially stated median.
How Household Income Changes With the Age of the Household Head
The mean and the median mix every household together. Grouped by the age of the household head, income rises to a peak in middle age and then falls again, tracing an arch.
* Compiled and edited by the Japan in Data editorial team based on official government statistics.
By age of household head, mean income is highest for heads aged 50 to 59, at ¥7.50 million, followed by those aged 40 to 49 at ¥7.398 million. Households headed by someone aged 29 or under average ¥3.364 million, and those headed by someone aged 70 or over ¥3.736 million, both less than half the peak level.
The curve shows that the overall mean of ¥5.36 million and median of ¥4,100,000 both reflect the age mix of households. Income levels differ widely between working-age households and older households that rely mainly on pensions, and the overall figures combine both groups in their current proportions. Household-level figures carry this age composition within them.
Household Income vs. Individual Pay: Two Different Measures
Many different “average income” figures circulate online, and a large share of them mix surveys from different sources. The table below sets the two main surveys side by side.
* Compiled and edited by the Japan in Data editorial team based on official government statistics.
Mean household income of ¥5.36 million (MHLW) and mean individual pay of ¥4.78 million (the National Tax Agency’s salary survey for 2024) are often quoted together, but they describe different populations. The first counts all income of a household, including earnings, pensions and property income. The second counts only the salary income of individual employees.
Household income and individual pay are not figures that can be compared directly on the same basis. Individual pay is sometimes described as having a “median of about ¥4,070,000”, but the National Tax Agency survey does not publish a median for individual pay. Most personal income medians that circulate online are estimates derived from monthly wages in the Basic Survey on Wage Structure.
Kaede’s Summary: Why the Mean and the Median Differ
Laid side by side, the distributions and comparisons in this article show why the mean and the median sit apart. They can be organized into three observations.
Applied to a single question, how much people in Japan earn, the charts in this article show the mean and the median standing at different points on the same distribution. The figure chosen, and the population it covers, change what the data appears to say. The aim here is not to rank the numbers but to record how they differ.
Read together, the three observations frame the gap as a structural feature. The difference between “average income” and “middle income” arises from the shape of the income distribution itself. The mean reflects the center of gravity of the whole distribution, and the median the middle of the ranking. Whether a figure is a mean or a median, and whether it covers households or individuals, changes the picture it gives.
Frequently Asked Questions
Two points decide what an income figure shows: whether it is a mean or a median, and whether it covers households or individuals. A change in either one changes the number.
Q1. Why Is Average Income Higher Than the Median?
Household income has a right-skewed distribution, with a peak at the lower end and a long tail toward higher incomes. A small number of high-income households raise the mean, while the median, which looks at the middle of the ranking, is little affected by them. For 2023 household income, the mean was ¥5,360,000 and the median ¥4,100,000, a gap of ¥1,260,000.
Q2. Is It Common to Have an Income Below the Average?
In a distribution with a long right tail, more people fall below the mean than above it. For 2023 household income, 61.9% of households were below the mean of ¥5.36 million, and the most common income band was ¥1 to ¥3 million. A majority sitting “below average” is consistent with the shape of the distribution.
Q3. Where Is the Median Income for Individuals Published?
The median household income is published in the MHLW Comprehensive Survey of Living Conditions. For individual pay, the National Tax Agency’s salary survey does not publish a median; it reports figures such as the mean of ¥4.78 million. Most “individual median income” figures seen online are estimates based on monthly wages in the Basic Survey on Wage Structure, and the source note shows whether a figure is official or estimated.
🔍 About the Fact-Check for This Article
Japan in Data fact-checks its articles. The evidence used to check the figures on this page is listed below.