
One way to test the feeling that earthquakes have become more frequent is to line up the number of strong shaking events year by year. Separating the count that includes small tremors from the count of intensity 5 Lower or above shows clearly which number moves and which does not.
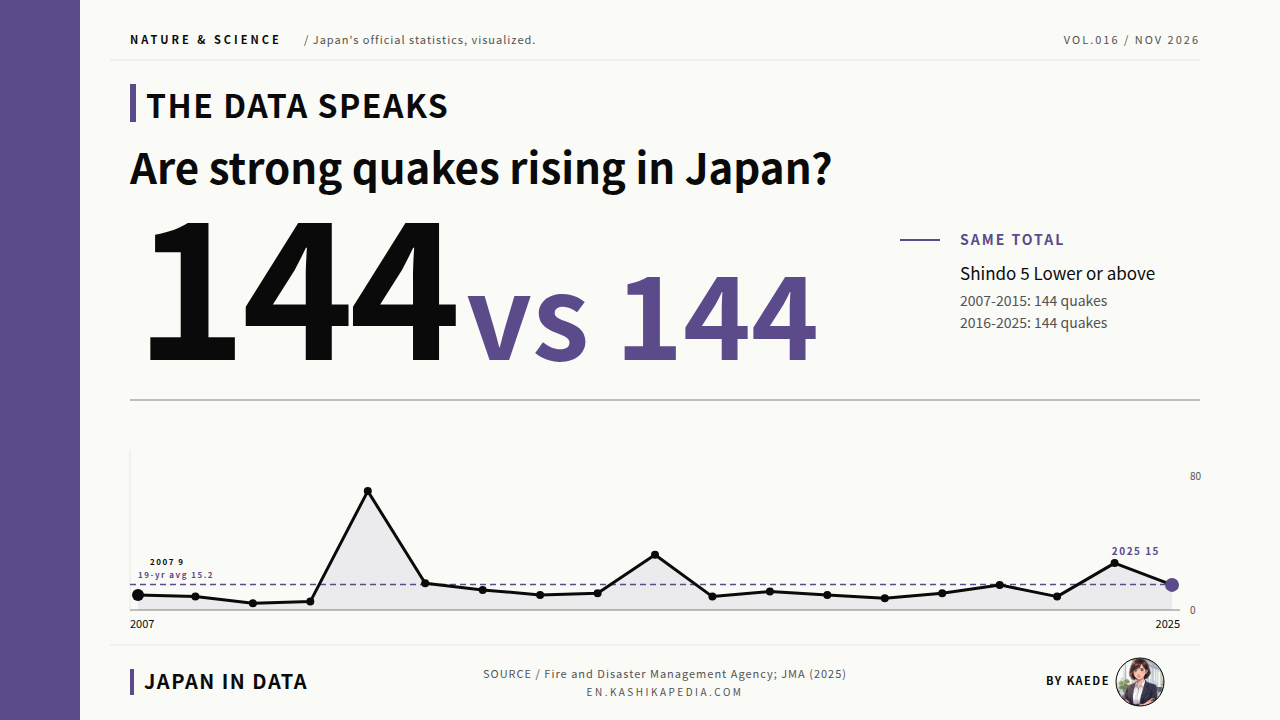
Counting the earthquakes in Japan with a maximum observed intensity of 5 Lower or above, the 19 years from 2007 to 2025 produced 288 in total, an average of 15.2 a year. Split roughly in half, the first nine years (2007 to 2015) recorded 144 and the last ten years (2016 to 2025) also recorded 144. Counted with this split, the two totals were identical.
The 19 years come to about 6,940 days. Divided by 288, that is roughly one such earthquake every 24 days. In 2025, by contrast, 4,456 earthquakes were observed at intensity 1 or above somewhere in Japan, and 15 of them reached intensity 5 Lower or above. The count of small shaking and the count of strong shaking move in different ways.
This article works from two primary sources: the counts by maximum intensity in the White Paper on Fire Service, published by the Fire and Disaster Management Agency, and the Japan Meteorological Agency’s Monthly Report on Earthquakes and Volcanoes in Japan. Charts set out annual counts, breakdowns by intensity class and monthly figures for 2025. The counts are observed as recorded, without assigning reasons to rises or falls.
Japan measures earthquake shaking with the Japan Meteorological Agency (JMA) seismic intensity scale, known as shindo. It describes how strongly the ground shakes at a given site, not the size of the earthquake itself, which is expressed as magnitude. The classes run up to 7, the highest, and intensities 5 and 6 are each split into Lower and Upper. One earthquake is recorded at many stations; the counts here use the highest intensity observed at any station in Japan. All figures follow the calendar year.
Have earthquakes of intensity 5 Lower or above become more frequent over these 19 years?
288 in 19 years. The first nine years and the last ten each recorded 144.
Source: Fire and Disaster Management Agency, White Paper on Fire Service, Table 1-6-1 (2017 and 2025 editions, both based on JMA intensity data); Japan Meteorological Agency, Monthly Report on Earthquakes and Volcanoes in Japan (December 2025)
* Compiled and edited by the Japan in Data editorial team based on official government statistics.
Figures are current as of the time of writing. Statistics, rules and services are subject to change, so please check the official sources for the latest information.
- 288 Quakes in 19 Years: Intensity 5 Lower or Above, Year by Year
- First Nine Years, Last Ten Years: 144 Each
- 43 Quakes at Intensity 6 Lower or Above, Five of Them at Intensity 7
- 2025 Month by Month: 4,456 at Intensity 1 or Above, 15 at 5 Lower or Above
- Why the Count Starts in 2007: Changes to the Scale and the Network
- Year-by-Year Table: The Breakdown From 2007 to 2025
- Kaede’s Summary: The Count Depends on What and When You Count
- Frequently Asked Questions
- 🔍 About the Fact-Check for This Article
288 Quakes in 19 Years: Intensity 5 Lower or Above, Year by Year
Stacking each year’s count by maximum intensity class in a column chart sets ordinary years beside years with a major earthquake. The same chart also shows that many years consist only of 5 Lower and 5 Upper events.
* Compiled and edited by the Japan in Data editorial team based on official government statistics.
The count here is the number of earthquakes for which at least one intensity station in Japan recorded a maximum of 5 Lower or above. It is not the number of earthquakes that occurred underground. An earthquake of the same size may be counted if it strikes near a station and left out if it occurs far offshore.
The total for the 19 years from 2007 to 2025 was 288, an average of 15.2 a year. The annual figures do not cluster around the average; they are heavily concentrated in a few years. Ranked from lowest to highest, the 19 years have a median of 10, more than 5 below the annual average of 15.2.
The highest count was 71 in 2011, followed by 33 in 2016 and 28 in 2024. Together these three years account for 132, or 45.8% of the 19-year total of 288. The remaining 16 years average 9.8 a year, close to the median of 10. The difference between the two averages shows how much weight the busiest years carry in the overall figure.
By intensity class, ordinary years consist only of 5 Lower and 5 Upper events. Several events at 6 Lower or above appear only in years with a major earthquake, such as 2011, 2016 and 2024. Within the same band of 5 Lower or above, the severity of what is counted differs widely from one year to the next.
First Nine Years, Last Ten Years: 144 Each
Split the 19 years roughly in half and the totals on each side match. This chart is placed here not to look for a difference but to confirm that there was none.
* Compiled and edited by the Japan in Data editorial team based on official government statistics.
Split into two periods, the nine years from 2007 to 2015 recorded 144 and the ten years from 2016 to 2025 also recorded 144. As annual averages, that is 16.0 for the first period and 14.4 for the second. Under this split, the two periods produced exactly the same total.
This does not establish that strong earthquakes have not increased. A different split produces different numbers. The first period, which includes 2011, has one year far above the rest, while the second has its counts gathered in 2016 and 2024. Depending on where the line is drawn, either period can come out higher.
Excluding the three busiest years (2011, 2016 and 2024), the remaining 16 years total 156, an average of 9.8 a year. That is 5.4 below the 19-year average of 15.2. The subtraction shows how far the counts in years with a major earthquake move the overall average.
43 Quakes at Intensity 6 Lower or Above, Five of Them at Intensity 7
Narrowing the band from 5 Lower or above to 6 Lower or above changes the picture again. Most years show zero, and only the years with a major earthquake stand out.
* Compiled and edited by the Japan in Data editorial team based on official government statistics.
Over the 19 years, 43 earthquakes reached intensity 6 Lower or above: 24 at 6 Lower, 14 at 6 Upper and 5 at 7. In five of the 19 years, not a single event of 6 Lower or above was recorded. Those years were 2010, 2012, 2015, 2017 and 2020.
Intensity 7 was observed five times: once in 2011, twice in 2016, once in 2018 and once in 2024. The two in 2016, during the Kumamoto Earthquake, were recorded on April 14 and April 16. It was the first time in the observation record that intensity 7 had been registered twice in the same area.
Counted as a single band of 5 Lower or above, the average is 15.2 a year. Limited to 6 Lower or above, the count is 43 in 19 years, or 2.3 a year. Limited to intensity 7, it is 5 in 19 years. With the same period and the same method, the threshold chosen shifts the count by an order of magnitude.
2025 Month by Month: 4,456 at Intensity 1 or Above, 15 at 5 Lower or Above
In 2025, the sheer number of tremors drew wide attention. Placing the monthly count at intensity 1 or above over the monthly count at 5 Lower or above shows directly how differently the two figures move.
* Compiled and edited by the Japan in Data editorial team based on official government statistics.
In 2025, 4,456 earthquakes in Japan reached intensity 1 or above. By month, June recorded 820 and July 1,701, and these two months alone account for more than half of the year. The JMA monthly reports for June and July describe seismic activity near the Tokara Islands, and that activity alone produced 1,002 events at intensity 1 or above in July.
In the same year, 15 earthquakes reached intensity 5 Lower or above. That is almost the same as the 19-year average of 15.2, and even July, the busiest month, recorded 7. Events of 5 Lower or above made up 0.34% of those at intensity 1 or above, or about 1 in 300.
The feeling that earthquakes are becoming more frequent is often described in connection with the count at intensity 1 or above. In 2025 that count moved sharply, while the count of strong shaking did not. The impression of the same year differs depending on which figure is in view. The 2025 figures are preliminary and may be revised after further review.
Why the Count Starts in 2007: Changes to the Scale and the Network
Before comparing counts, it helps to set out from which point they can be measured with the same yardstick. Across the dates when the intensity classes and the number of stations changed, counts cannot be compared as they are.
* Compiled and edited by the Japan in Data editorial team based on official government statistics.
The Japan Meteorological Agency applied a revised intensity scale from April 1, 1996, ending observation based on human perception and moving to instrumental seismic intensity meters. The classes 6 Upper, 6 Lower, 5 Upper and 5 Lower, however, came into use only on October 1 of the same year. Before then the scale had only intensity 5 and intensity 6, so a count of 5 Lower or above did not exist.
The number of observing stations also changed. Since November 10, 1997, the agency has published intensity information using not only its own meters but also data provided by local governments and the National Research Institute for Earth Science and Disaster Resilience (NIED). As of April 1, 2025, local governments operated about 2,900 intensity meters nationwide.
With more stations, shaking that previously went uncounted enters the count. A change in classes changes the band being counted. Lining up counts across these two changes mixes changes on the earthquake side with changes on the counting side. This article starts in 2007 so that the period begins well after both changes.
Year-by-Year Table: The Breakdown From 2007 to 2025
The combinations of year and intensity class are also set out as a table. It is divided into three periods; select the tab for the years you want to see.
Earthquakes in Japan with a maximum intensity of 5 Lower or above, 2007 to 2012
| Year | 5 Lower | 5 Upper | 6 Lower | 6 Upper | 7 | Total |
|---|---|---|---|---|---|---|
| 2007 | 4 | 2 | 1 | 2 | 0 | 9 |
| 2008 | 6 | 0 | 1 | 1 | 0 | 8 |
| 2009 | 3 | 0 | 1 | 0 | 0 | 4 |
| 2010 | 5 | 0 | 0 | 0 | 0 | 5 |
| 2011 | 45 | 17 | 4 | 4 | 1 | 71 |
| 2012 | 12 | 4 | 0 | 0 | 0 | 16 |
Earthquakes in Japan with a maximum intensity of 5 Lower or above, 2013 to 2018
| Year | 5 Lower | 5 Upper | 6 Lower | 6 Upper | 7 | Total |
|---|---|---|---|---|---|---|
| 2013 | 5 | 6 | 1 | 0 | 0 | 12 |
| 2014 | 7 | 1 | 1 | 0 | 0 | 9 |
| 2015 | 5 | 5 | 0 | 0 | 0 | 10 |
| 2016 | 18 | 5 | 6 | 2 | 2 | 33 |
| 2017 | 4 | 4 | 0 | 0 | 0 | 8 |
| 2018 | 7 | 2 | 1 | 0 | 1 | 11 |
Earthquakes in Japan with a maximum intensity of 5 Lower or above, 2019 to 2025
| Year | 5 Lower | 5 Upper | 6 Lower | 6 Upper | 7 | Total |
|---|---|---|---|---|---|---|
| 2019 | 6 | 0 | 2 | 1 | 0 | 9 |
| 2020 | 6 | 1 | 0 | 0 | 0 | 7 |
| 2021 | 4 | 5 | 0 | 1 | 0 | 10 |
| 2022 | 7 | 6 | 1 | 1 | 0 | 15 |
| 2023 | 5 | 2 | 0 | 1 | 0 | 8 |
| 2024 | 14 | 9 | 4 | 0 | 1 | 28 |
| 2025 | 9 | 4 | 1 | 1 | 0 | 15 |
* Compiled and edited by the Japan in Data editorial team based on official government statistics.
Each figure in the table is the number of earthquakes in that year with a maximum observed intensity of 5 Lower or above in Japan. The table is split into three periods, but all 19 years of data are on this page. Besides annual totals, it shows how many events fell into each class from 5 Lower to 7.
The six years from 2007 to 2012 total 113, the six years from 2013 to 2018 total 83, and the seven years from 2019 to 2025 total 92. Under this split of six, six and seven years, the first six years are the highest, and most of that total comes from the 71 events of 2011.
Kaede’s Summary: The Count Depends on What and When You Count
Taken together, the charts so far show that the same earthquake record takes a different shape depending on which intensity threshold and which period are counted. Here are three observations.
On the question of whether earthquakes of intensity 5 Lower or above are increasing, the charts in this article showed one relationship: once the counting band is chosen, the range of possible answers is set as well. Rather than adding an evaluation to the data, this section sets out the differences in how it appears as observed facts.
Read together, the three observations show that the answer to whether strong earthquakes are increasing changes with the threshold, the period and the unit of counting. What this article can show is that, counted over these 19 years with this split, the two totals were the same. It makes no statement about what may happen in the future.
Frequently Asked Questions
When reading a chart of earthquake counts, it helps to check three things together: the band being counted, the period being counted and the number of observing stations. When any of the three changes, the same data reads differently.
Q1. Are Earthquakes of Intensity 5 Lower or Above Increasing?
What this article can show is that when the 19 years from 2007 to 2025 are split into the first nine and the last ten, both totals come to 144. The 19-year total was 288, with an average of 15.2 a year and a median of 10. Because a different split gives different numbers, the observation that the totals matched under this split is a separate matter from any judgment about increase or decrease.
Q2. Is the Count the Same as the Number of Earthquakes That Occurred?
No. The count here is the number of earthquakes for which at least one intensity station in Japan recorded a maximum of 5 Lower or above. An earthquake of the same size may be counted if it occurs near a station and left out if it occurs far offshore. When the number of stations changes, the amount of shaking that enters the count changes as well.
Q3. Why Does the Count Start in 2007 Rather Than 1919?
The intensity classes and the observation network changed along the way. The classes 6 Upper, 6 Lower, 5 Upper and 5 Lower came into use on October 1, 1996; before that, a count of 5 Lower or above did not exist. From November 10, 1997, data from local governments and NIED were also added to intensity information. Counting across both changes mixes changes in earthquakes with changes in counting, so this article covers 2007 onward.
🔍 About the Fact-Check for This Article
Japan in Data fact-checks its articles. The evidence for the fact-check of this page is set out below.