
What a rice price figure means depends on which stage of trade it comes from. Charting the trading price per 60 kg of brown rice and the shop price per 5 kg of milled rice separately shows, stage by stage, how prices fell in autumn 2026.
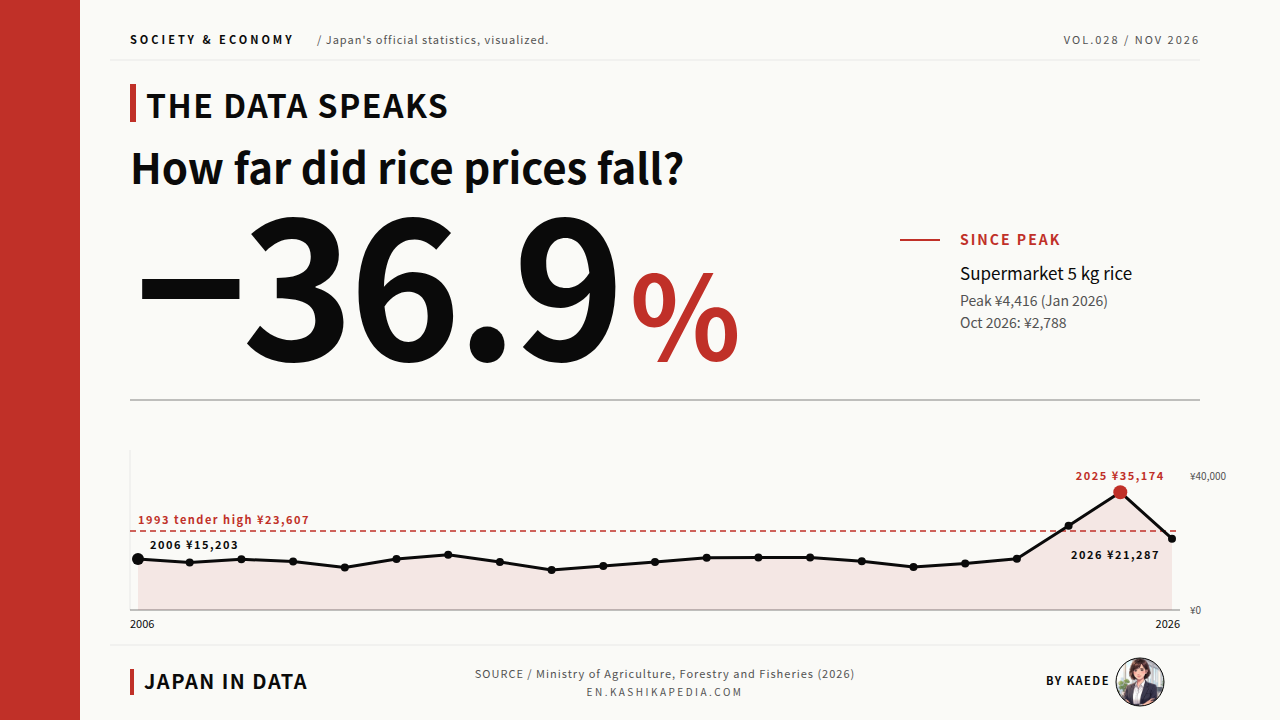
Japan’s Ministry of Agriculture, Forestry and Fisheries (MAFF) tracks the average supermarket price of 5 kg of milled rice. It peaked at ¥4,416 in the week of December 29, 2025 to January 4, 2026, and stood at ¥2,788 in the week of October 19 to 25, 2026, ¥1,628 (36.9%) below the peak and 33.7% below a year earlier. The negotiated transaction price (aitai torihiki kakaku) between rice collectors and wholesalers, per 60 kg of brown rice, was ¥21,293 in September 2026, the first month of the 2026 crop, 42% below the same month a year earlier.
Averaged by crop year, the negotiated price rose from ¥15,315 for the 2023 crop to ¥35,174 for the 2025 crop (preliminary), about 2.3 times in two years. This article uses MAFF’s negotiated and supermarket prices published in October 2026, records of government purchase prices, and retail price statistics from the Ministry of Internal Affairs and Communications (MIC) to chart 75 years, from the 1950 crop to the 2025 crop, and the rise and fall since autumn 2025.
Rice prices in Japan are reported at more than one stage of distribution. Wholesale trades are priced per 60 kg of brown rice (genmai), rice that has been husked but not polished. Shops sell milled white rice, usually in 5 kg bags. Prices are grouped by crop year: the 2025 crop is rice harvested in 2025 and traded from that autumn. Official tables label crop years by the Japanese era, so the 2025 crop appears as Reiwa 7. The ward area of Tokyo (Tokyo-to kubu) is the central part of Tokyo Metropolis, made up of its special wards.
How far did rice prices rise at each stage, and how far had they fallen by October 2026?
Shop prices are 36.9% below their peak, and wholesale prices are 42% below a year earlier.
Information is current as of the time of writing. Figures, rules and services are subject to change, so please check each official source for the latest information.
- Which Rice Price? Government Purchase, Wholesale and Shop Prices
- How the Price of 60 kg of Brown Rice Moved, 1950 to 2025 Crops
- Monthly Negotiated Prices: The 2026 Crop Opens at ¥21,293
- Supermarket Prices: 5 kg of Milled Rice Falls From ¥4,416 to ¥2,788
- Koshihikari 5 kg in Tokyo: Monthly Shop Prices Since 2002
- Year on Year at Two Stages: Down 42% and Down 33.7%
- Kaede’s Summary: Rice Prices Rose and Fell Differently at Each Stage
- Frequently Asked Questions
- 🔍 About the Fact-Check for This Article
Which Rice Price? Government Purchase, Wholesale and Shop Prices
When reading rice price news, checking first which stage a price comes from and per how many kilograms it is quoted reduces confusion. The prices used in this article are set out here before the charts.
The three prices differ in system, distribution stage and unit. Between 60 kg of brown rice and 5 kg of milled rice lie the weight lost in milling and the costs of distribution, so this article does not convert one into the other to join them as a single line. Comparisons are made only between prices at the same stage and in the same unit.
At the wholesale stage, the available series change over time: government purchase prices run to the 2003 crop, tender prices from the 1990 to the 2009 crop, and negotiated prices from the 2006 crop. Where series overlap, both values are kept and drawn with different line styles. The two shop prices also differ in region, brand and method of compilation, so each has its own chart.
How the Price of 60 kg of Brown Rice Moved, 1950 to 2025 Crops
With the three series on one line chart across 75 years, prices stay within the low ¥20,000s for a long time, then jump sharply in just the last two years. The 2026 crop covers one month of preliminary data, so it sits as a hollow point, not joined to the line.
* Compiled and edited by the Japan in Data editorial team based on official government statistics.
Government purchase prices rose from ¥2,504.82 for the 1950 crop and reached their highest value, ¥18,668, for the 1984 to 1986 crops. They fell from the 1987 crop onward, ending at ¥13,820 for the 2003 crop, the last in the series. Tender prices peaked at ¥23,607 for the 1993 crop and, with rises and falls along the way, declined to ¥16,048 for the 2005 crop.
The negotiated price series starts with the 2006 crop, and its lowest value is ¥11,967 for the 2014 crop. From the 2015 to the 2023 crop it stayed between ¥12,804 and ¥15,716. It then rose to ¥25,179 for the 2024 crop and ¥35,174 (preliminary) for the 2025 crop, two large rises in a row. The 2025 crop figure is about 2.9 times the ¥11,967 recorded for the 2014 crop.
The crop-year average for the 2026 crop is a preliminary ¥21,287, based only on September 2026, the month the new crop reached the market. It is 39% below the 2025 crop, but it comes from a period when 2025-crop rice was still being traded and trading volumes of the new crop were small.
Apart from the wholesale stage, MIC’s Retail Price Survey holds shop prices for ordinary (non-glutinous) rice in the ward area of Tokyo from 1950 to 2010. The published unit was 1 kg through 1972, 10 kg from 1973 to 2001, and a 5 kg bag from 2002, so the values are converted to a 5 kg basis by unit only and set side by side.
* Compiled and edited by the Japan in Data editorial team based on official government statistics.
From 1973 onward, the highest converted value is ¥3,080.5 in 1994 (¥6,161 per 10 kg), and the 2010 value is ¥1,739. The item category changed in 1972, 1973, 1996 and 2002, so the chart breaks the line at each change. The series ends in 2010; shop prices in Tokyo from 2002 onward appear later in this article, in a monthly series fixed on the Koshihikari brand.
Prices by Crop Year: Three Series in Tabs
The values behind the chart are listed below by series. Switching tabs shows every crop year for government purchase prices (1950 to 2003 crops), tender prices (1990 to 2009 crops) and negotiated prices (2006 to 2026 crops). The era column gives the Japanese calendar label used in the official tables.
| Crop year | Era label | ¥ per 60 kg |
|---|---|---|
| 1950 | Showa 25 | 2,504.82 |
| 1951 | Showa 26 | 3,040.56 |
| 1952 | Showa 27 | 3,454 |
| 1953 | Showa 28 | 4,273 |
| 1954 | Showa 29 | 4,003 |
| 1955 | Showa 30 | 4,064 |
| 1956 | Showa 31 | 4,028 |
| 1957 | Showa 32 | 4,129 |
| 1958 | Showa 33 | 4,129 |
| 1959 | Showa 34 | 4,133 |
| 1960 | Showa 35 | 4,162 |
| 1961 | Showa 36 | 4,421 |
| 1962 | Showa 37 | 4,866 |
| 1963 | Showa 38 | 5,268 |
| 1964 | Showa 39 | 5,985 |
| 1965 | Showa 40 | 6,538 |
| 1966 | Showa 41 | 7,140 |
| 1967 | Showa 42 | 7,797 |
| 1968 | Showa 43 | 8,256 |
| 1969 | Showa 44 | 8,256 |
| 1970 | Showa 45 | 8,272 |
| 1971 | Showa 46 | 8,522 |
| 1972 | Showa 47 | 8,954 |
| 1973 | Showa 48 | 10,301 |
| 1974 | Showa 49 | 13,615 |
| 1975 | Showa 50 | 15,570 |
| 1976 | Showa 51 | 16,572 |
| 1977 | Showa 52 | 17,232 |
| 1978 | Showa 53 | 17,251 |
| 1979 | Showa 54 | 17,279 |
| 1980 | Showa 55 | 17,674 |
| 1981 | Showa 56 | 17,756 |
| 1982 | Showa 57 | 17,951 |
| 1983 | Showa 58 | 18,266 |
| 1984 | Showa 59 | 18,668 |
| 1985 | Showa 60 | 18,668 |
| 1986 | Showa 61 | 18,668 |
| 1987 | Showa 62 | 17,557 |
| 1988 | Showa 63 | 16,743 |
| 1989 | Heisei 1 | 16,743 |
| 1990 | Heisei 2 | 16,500 |
| 1991 | Heisei 3 | 16,392 |
| 1992 | Heisei 4 | 16,392 |
| 1993 | Heisei 5 | 16,392 |
| 1994 | Heisei 6 | 16,392 |
| 1995 | Heisei 7 | 16,392 |
| 1996 | Heisei 8 | 16,392 |
| 1997 | Heisei 9 | 16,217 |
| 1998 | Heisei 10 | 15,805 |
| 1999 | Heisei 11 | 15,528 |
| 2000 | Heisei 12 | 15,104 |
| 2001 | Heisei 13 | 14,708 |
| 2002 | Heisei 14 | 14,295 |
| 2003 | Heisei 15 | 13,820 |
| Crop year | Era label | ¥ per 60 kg |
|---|---|---|
| 1990 | Heisei 2 | 21,600 |
| 1991 | Heisei 3 | 22,726 |
| 1992 | Heisei 4 | 22,813 |
| 1993 | Heisei 5 | 23,607 |
| 1994 | Heisei 6 | 22,213 |
| 1995 | Heisei 7 | 21,017 |
| 1996 | Heisei 8 | 20,751 |
| 1997 | Heisei 9 | 18,717 |
| 1998 | Heisei 10 | 19,645 |
| 1999 | Heisei 11 | 17,961 |
| 2000 | Heisei 12 | 17,096 |
| 2001 | Heisei 13 | 17,293 |
| 2002 | Heisei 14 | 17,171 |
| 2003 | Heisei 15 | 22,296 |
| 2004 | Heisei 16 | 16,660 |
| 2005 | Heisei 17 | 16,048 |
| 2006 | Heisei 18 | 15,731 |
| 2007 | Heisei 19 | 15,075 |
| 2008 | Heisei 20 | 16,099 |
| 2009 | Heisei 21 | 15,610 |
| Crop year | Era label | ¥ per 60 kg |
|---|---|---|
| 2006 | Heisei 18 | 15,203 |
| 2007 | Heisei 19 | 14,164 |
| 2008 | Heisei 20 | 15,146 |
| 2009 | Heisei 21 | 14,470 |
| 2010 | Heisei 22 | 12,711 |
| 2011 | Heisei 23 | 15,215 |
| 2012 | Heisei 24 | 16,501 |
| 2013 | Heisei 25 | 14,341 |
| 2014 | Heisei 26 | 11,967 |
| 2015 | Heisei 27 | 13,175 |
| 2016 | Heisei 28 | 14,307 |
| 2017 | Heisei 29 | 15,595 |
| 2018 | Heisei 30 | 15,688 |
| 2019 | Reiwa 1 | 15,716 |
| 2020 | Reiwa 2 | 14,529 |
| 2021 | Reiwa 3 | 12,804 |
| 2022 | Reiwa 4 | 13,844 |
| 2023 | Reiwa 5 | 15,315 |
| 2024 | Reiwa 6 | 25,179 |
| 2025 | Reiwa 7 | 35,174 (prelim.) |
| 2026 | Reiwa 8 | 21,287 (prelim., Sep only) |
* Compiled and edited by the Japan in Data editorial team based on official government statistics.
Monthly Negotiated Prices: The 2026 Crop Opens at ¥21,293
Crop-year averages hide the movement within a year. Overlaying the 2022 to 2026 crops, each aligned to the month it reached the market, shows where the first point for the 2026 crop sits.
* Compiled and edited by the Japan in Data editorial team based on official government statistics.
The negotiated price for the 2025 crop opened at ¥36,895 in September 2025 and reached ¥37,058 in October, the highest monthly value. It then fell month after month and stood at ¥31,556 in August 2026. The 2024 crop opened at ¥22,700 in September 2024 and rose to ¥27,649 by May 2025.
The first month of the 2026 crop, September 2026, came in at ¥21,293. That is ¥15,602, or 42%, below the same month a year earlier (September 2025, 2025 crop), and ¥1,407 below the same month two years earlier (September 2024, 2024 crop). Against the 2025 crop’s monthly peak, it is 42.5% lower.
Trading volume that month, however, was 54,000 tonnes, 66% less than a year earlier. According to MAFF, trading in 2025-crop rice was still continuing, among other factors, so volumes of the new 2026 crop were smaller than in a typical year.
Supermarket Prices: 5 kg of Milled Rice Falls From ¥4,416 to ¥2,788
Shop prices are published every week, so a weekly line shows the slope of the decline clearly. The 60 weeks from September 2025 in the table published on October 30, 2026 are joined here in a single line.
* Compiled and edited by the Japan in Data editorial team based on official government statistics.
MAFF’s average selling price for 5 kg of milled rice (tax included), compiled from POS data at about 1,000 supermarkets nationwide, was ¥4,155 in the week of September 1 to 7, 2025. It moved between ¥4,142 and ¥4,337 through December, and the week of December 29, 2025 to January 4, 2026 recorded ¥4,416, the highest in these 60 weeks.
Through 2026 the price fell week by week and dropped below ¥3,000, to ¥2,971, in the week of September 7 to 13, 2026. In the week of October 19 to 25 it was ¥2,788, ¥33 below the previous week and ¥1,420 (33.7%) below the same week a year earlier (¥4,208 in the week of October 20 to 26, 2025). Branded rice averaged ¥2,811 and blended rice and others ¥2,678, and sales volume that week was 9.1% higher than a year earlier.
Against the peak week, the latest figure is ¥1,628, or 36.9%, lower. Taking one bowl of rice as 65 g of uncooked milled rice, a bowl cost about ¥57 in the peak week and about ¥36 in the latest week.
Koshihikari 5 kg in Tokyo: Monthly Shop Prices Since 2002
Separately from supermarket POS data, MIC surveys the price of a 5 kg bag of Koshihikari rice every month at selected stores in the ward area of Tokyo. Drawn as one line over nearly 25 years from 2002, the rise from 2024 and the fall in 2026 sit beside the previous 20 years.
* Compiled and edited by the Japan in Data editorial team based on official government statistics.
In MIC’s Retail Price Survey, the price of a 5 kg bag of Koshihikari in the ward area of Tokyo has been recorded since January 2002. From 2002 to 2023, annual averages ranged from ¥2,285 to ¥3,146, and July 2022, at ¥2,227, was the lowest month in that period. Prices began rising in 2024: the annual average went from ¥2,323 in 2023 to ¥2,951 in 2024 and ¥4,928 in 2025.
The monthly peak was ¥5,448 in November 2025. Prices then fell month after month in 2026, reaching ¥4,051 in September 2026. That is 25.6% below the peak and 17.0% below the same month a year earlier (¥4,879 in September 2025). The line runs continuously across a November 2009 revision of the item definition, from single variety to single-source rice, both in domestic 5 kg bags.
This statistic tracks a fixed brand at surveyed stores in the ward area of Tokyo, which differs in region, brand and method from the all-brand POS average for supermarkets nationwide. In September 2026, the POS weekly values ranged from ¥2,860 to ¥3,003, while the Tokyo Koshihikari price was ¥4,051. Because the levels differ, this article does not join the two into one line or calculate a gap between them.
Year on Year at Two Stages: Down 42% and Down 33.7%
Up to the figures published for August 2026, the wholesale stage was above the previous year and the shop stage below it. Redrawn as two bars from the same zero line, both extend in the same direction in autumn 2026.
* Compiled and edited by the Japan in Data editorial team based on official government statistics.
The negotiated price (per 60 kg of brown rice) for September 2026 was down 42% year on year, and the supermarket price (per 5 kg of milled rice) for the week of October 19 to 25, 2026 was down 33.7%. Both the wholesale and shop stages are below the previous year, and the size of the fall differs by stage.
The two figures, however, differ in item (brown and milled rice), unit (60 kg and 5 kg) and period (a September monthly average and the week of October 19 to 25). The wholesale value is also the first month of the 2026 crop, when trading volume was small. This article does not combine them into one number and presents each only as its own year-on-year change.
Kaede’s Summary: Rice Prices Rose and Fell Differently at Each Stage
Set side by side, the charts show, on the same official releases, how large the last two years were within a 75-year record, and that the decline differs by stage and brand. Here are three observations.
This article has addressed how far rice prices rose and how far they have fallen using only figures published by MAFF and MIC. The direction and size of the numbers change depending on which stage’s price is examined and over which period it is measured.
Viewed alone, the period of rising prices and the period of falling prices can look like separate stories. Placed on the same official releases, they read as one series in which timing and size differ between the wholesale and shop stages. In autumn 2026, wholesale and shop prices were both below the previous year, while the size of the fall differed by stage and brand. The reasons prices moved lie outside the data shown here and are not covered. The latest figures appear in MAFF’s monthly negotiated price releases and weekly supermarket price releases.
Frequently Asked Questions
Here are three points that often cause confusion when reading rice price figures: the difference between wholesale and shop prices, how preliminary values are handled, and where to find the latest figures.
Q1. How does the negotiated price differ from the supermarket price?
The negotiated transaction price is the price in trades between rice collectors and wholesalers and similar buyers, per 60 kg of brown rice, including packaging, freight and consumption tax equivalents. The supermarket price is the average selling price (tax included) of 5 kg of milled rice from POS data at about 1,000 stores nationwide. Because stage and unit differ, this article does not convert one to compare it with the other. In September 2026 the negotiated price was ¥21,293; in the week of October 19 to 25, 2026 the supermarket price was ¥2,788.
Q2. Are ¥35,174 for the 2025 crop and ¥21,287 for the 2026 crop final figures?
Neither is final. MAFF publishes the crop-year averages for the 2025 and 2026 crops as preliminary values based on trades from each crop’s release through September 2026. The 2025 crop figure was revised from ¥35,330, the preliminary value through August 2026 used when this analysis was first published, to ¥35,174 with September added. The 2026 crop figure covers September alone. Final values are published after trading for each crop year ends, so the figures may change.
Q3. What will happen to rice prices next?
This article does not cover the outlook. MAFF publishes negotiated prices monthly and supermarket sales volumes and prices weekly, and MIC publishes retail prices for the ward area of Tokyo monthly, so the latest values can be checked in each release. The figures in this article are based on releases published on October 16, October 23 and October 30, 2026.
🔍 About the Fact-Check for This Article
Japan in Data fact-checks its articles. The evidence behind the fact-check for this page is set out below.