
Saying a country is “number X in the world” and saying it accounts for “X% of the world” can come from the same data, yet the two move differently. This article sets out the rank as a staircase, the share as a line, and the yen and dollar series side by side, one at a time.
Japan’s nominal GDP overtook that of West Germany (as it then was) in 1968 to rank second in the world. China moved ahead in 2010 and Germany in 2023, leaving Japan fourth. The IMF’s World Economic Outlook (April 2026) also places Japan fourth in both its 2025 estimate and its 2026 projection. By rank, Japan has moved down two places over the past 20 years.
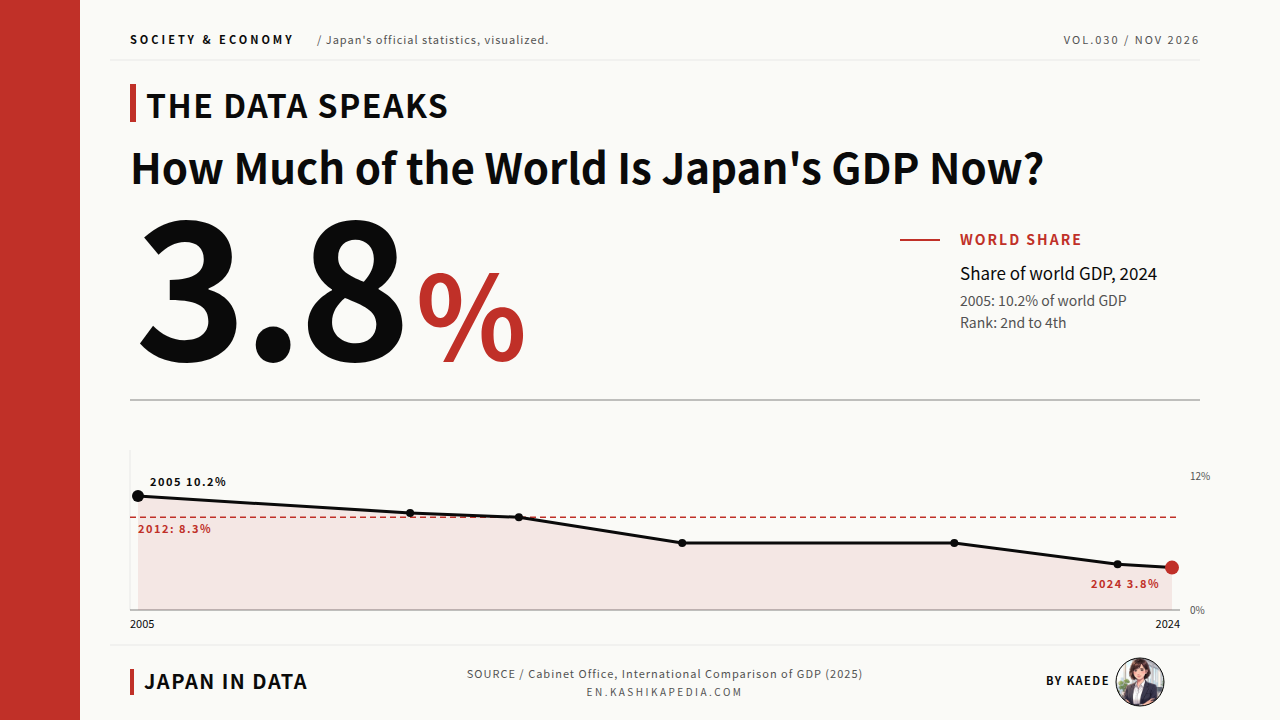
According to the Cabinet Office’s International Comparison of GDP, Japan’s share of world nominal GDP fell from 10.2% in 2005 to 3.8% in 2024. The rank moved two places; the share fell to just over a third. If world GDP were represented as 100 coins, Japan would have held about 10 of them in 2005 and about 4 in 2024 (editorial team’s calculation).
This article uses primary data from Japan’s Cabinet Office and the International Monetary Fund (IMF) to set out where the Japanese economy stands from three angles: the rank, the share of the world total, and the difference between dollar and yen measures. It does not attribute causes or make forecasts; it only observes the published figures.
Gross domestic product (GDP) is the total value added produced within a country. Nominal GDP is measured at current prices without adjusting for inflation. International rankings convert each country’s GDP into US dollars, and the exchange rate used enters the comparison. Japan’s official figures come from the Cabinet Office, which compiles the national accounts; the IMF publishes separate estimates and projections in its World Economic Outlook. Figures in this article are calendar-year values. The Cabinet Office report cited here is labelled FY2024 (April 2024 to March 2025).
Japan was once the world’s second-largest economy. How much of the world does it account for now?
The rank slipped two places, from 2nd to 4th. The share of the world fell to just over a third.
* Compiled and edited by the Japan in Data editorial team based on official government statistics.
Figures are current as of the time of writing. Statistics, rules and services are subject to change, so please check the official sources for the latest information.
- Three Years When the Rank Moved: 1968, 2010 and 2023
- Japan’s Nominal GDP in US Dollars: The 2012 Peak and 2024
- Six Major Economies Side by Side: The Changes of 2010 and 2023
- What Moved More Than the Rank: World Share Fell From 10.2% to 3.8%
- Yen and Dollars: Measuring One Economy With Two Rulers
- Per Capita: Japan’s Position Within the OECD
- Kaede’s Summary: Japan’s Position by Rank, Share and Currency
- Frequently Asked Questions
- 🔍 About the Fact-Check for This Article
Three Years When the Rank Moved: 1968, 2010 and 2023
A rank does not shift a little each year. It stays in one place for a long time, then moves a single step in a particular year. Drawing the staircase from 1950 onward in one chart shows exactly which years those steps fell in.
* Compiled and edited by the Japan in Data editorial team based on official government statistics.
According to the Economic Planning Agency’s Annual Economic Report (Showa 44 edition), Japan’s gross national product ranked 7th in the free world in 1950. It passed India to rank 6th in 1955 and Canada to rank 5th in 1960. In 1968 it passed West Germany (as it then was) to rank 2nd, behind only the United States. The report gives the 1968 figure as $141.9 billion (preliminary).
The measure needs care here. The comparison made in 1968 was based on GNP (gross national product), a different concept from today’s nominal GDP. GNP totals the income earned by a country’s residents at home and abroad, while GDP totals the value added produced within the country. Both describe economic size, but they draw the boundary differently.
Japan held 2nd place for 42 years, from 1968 to 2009. China moved ahead in 2010, putting Japan 3rd, a position it kept for 13 years through 2022. Germany moved ahead in 2023, putting Japan 4th, and the IMF projection keeps Japan 4th in 2026. These three years are the only points at which the rank changed.
Japan’s Nominal GDP in US Dollars: The 2012 Peak and 2024
Behind every rank is an amount. Laying out the IMF’s dollar-based nominal GDP from 1980 onward shows the peaks, the troughs and the most recent position in a single line, together with the two years in which another economy moved ahead of Japan.
* Compiled and edited by the Japan in Data editorial team based on official government statistics.
According to the IMF’s World Economic Outlook (April 2026), Japan’s nominal GDP grew from $1,155.2 billion in 1980 to a peak of $6,333.8 billion in 2012. It has since moved down and up in turn, standing at $4,190.0 billion in 2024. Compared with the 2012 level, the 2024 figure is about 34% lower.
For the most recent years, the IMF gives an estimate of $4,435.2 billion for 2025 and a projection of $4,379.3 billion for 2026. These correspond to the dotted section of the chart. Estimates and projections differ in nature from actual figures, so this article does not treat them as final values.
For the same year, 2024, the Cabinet Office puts Japan’s nominal GDP at $4,186.9 billion. The gap with the IMF’s $4,190.0 billion is about $3.1 billion, or 0.07%. The two figures come from different estimating bodies using different currency conversion methods, and neither is an error. This article shows each series with its own source.
Six Major Economies Side by Side: The Changes of 2010 and 2023
A rank depends on the other countries in the comparison. Placing the leading economies in the same chart as Japan shows which country changed places with Japan, and in which year. Because the figures differ by close to a factor of 10, the upper and lower panels use separate scales.
* Compiled and edited by the Japan in Data editorial team based on official government statistics.
Lining up the 20 years from 2005 in the Cabinet Office’s International Comparison of GDP, China reached $6,192.6 billion in 2010, above Japan’s $5,811.7 billion. In 2023 Germany reached $4,562.2 billion, above Japan’s $4,385.4 billion. The upper panel of the chart shows the United States and China; the lower panel shows Germany, Japan, the UK and India.
In 2024 the order was Germany at $4,685.6 billion, Japan at $4,186.9 billion, India at $3,909.9 billion and the United Kingdom at $3,685.9 billion. Japan’s figure is 89.4% of Germany’s, and India’s is 93.4% of Japan’s. The gaps among these leading economies are smaller than they were earlier in the period.
In the IMF’s April 2026 edition, both the 2025 estimate and the 2026 projection rank Japan 4th, the UK 5th and India 6th. The October 2025 edition had projected that India would move ahead of Japan in 2026. Projections are revised with each edition, and this article shows the order in the latest one.
The IMF’s projection for 2027 puts India at $4,579.1 billion and Japan at $4,561.6 billion, which would place India ahead of Japan. This is the content of a projection published by the IMF, not a forecast made by Japan in Data, and like other projections it is revised from one edition to the next.
What Moved More Than the Rank: World Share Fell From 10.2% to 3.8%
This is the chart I would most like readers to see. The rank has moved only two places, but over the same period Japan’s share of the world total has moved much further. China’s share is drawn on the same scale as a lighter line.
* Compiled and edited by the Japan in Data editorial team based on official government statistics.
The Cabinet Office’s international comparison tables include each country’s share of world nominal GDP. Japan’s share was 10.2% in 2005, 8.3% in 2012 and 3.8% in 2024. That is a fall of 6.4 points, or 0.37 times the 2005 level. While the rank moved only two places, the share fell to just over a third.
Over the same period, China’s share rose from 4.8% to 16.8%, while the United States moved from 27.2% to 26.2%, close to flat. World nominal GDP grew 2.3 times, from $48.0 trillion to $111.6 trillion, and the shift in how that total is divided among countries appears in the share lines.
Rank and share are calculated from the same data but behave differently. A rank reflects only the order relative to other countries, so it stays the same while gaps are small. A share is a proportion of the world total, so it keeps moving even in years when the rank does not. Viewing both together gives a fuller picture of a change in position.
Yen and Dollars: Measuring One Economy With Two Rulers
So far the figures have been in US dollars. Set out in yen over the same period, nominal GDP runs in the other direction. The question here is not which measure is correct, but how the picture changes when the measuring stick changes.
* Compiled and edited by the Japan in Data editorial team based on official government statistics.
According to the Cabinet Office’s Quarterly Estimates of GDP, nominal calendar-year GDP in yen reached ¥666,441.9 billion in 2025, the largest figure since 1994, the earliest year in the series. It rose for five consecutive years from 2021 to 2025. Setting 2012’s ¥505,377.1 billion at 100, the 2025 figure is 131.9.
Measured in dollars over the same period, the picture differs. In the Cabinet Office’s international comparison tables, setting 2012’s $6,332.4 billion at 100 gives 66.1 for 2024. In yen, nominal GDP is about 30% above its 2012 level; in dollars, it is a little more than 30% below. Both describe the same economy in the same years, measured in different currencies.
The same Cabinet Office document notes the yen’s exchange rate against the dollar as ¥140.5 in 2023 and ¥151.5 in 2024. The yen series, the dollar series and the level of the exchange rate: setting these three facts side by side is as far as the published data allows this article to go.
| Year | Japan’s nominal GDP | Type | World rank |
|---|---|---|---|
| 2012 | $6,333.8 billion | Actual | 3rd |
| 2020 | $5,189.2 billion | Actual | 3rd |
| 2022 | $4,448.0 billion | Actual | 3rd |
| 2023 | $4,384.9 billion | Actual | 4th |
| 2024 | $4,190.0 billion | Actual | 4th |
| 2025 | $4,435.2 billion | Estimate | 4th |
| 2026 | $4,379.3 billion | Projection | 4th |
In 2026 the leading economies are the United States at $32,383.9 billion, China at $20,851.6 billion, Germany at $5,452.9 billion, Japan at $4,379.3 billion, the UK at $4,264.8 billion and India at $4,153.2 billion (IMF projection, April 2026 edition).
| Year | Nominal GDP, calendar year | 2012 = 100 |
|---|---|---|
| 2012 | ¥505,377.1 billion | 100.0 |
| 2019 | ¥571,838.0 billion | 113.1 |
| 2020 | ¥554,074.4 billion | 109.6 |
| 2022 | ¥584,501.3 billion | 115.7 |
| 2023 | ¥616,659.4 billion | 122.0 |
| 2024 | ¥636,893.3 billion | 126.0 |
| 2025 | ¥666,441.9 billion | 131.9 |
Series on a 2020 base year. Figures from 1994 onward have been revised retroactively in line with the benchmark revision.
| Year | Japan | China | United States |
|---|---|---|---|
| 2005 | 10.2% | 4.8% | 27.2% |
| 2010 | 8.7% | 9.2% | 22.5% |
| 2012 | 8.3% | 11.4% | 21.4% |
| 2015 | 6.0% | 14.9% | 24.2% |
| 2020 | 6.0% | 17.4% | 24.7% |
| 2023 | 4.1% | 17.0% | 25.8% |
| 2024 | 3.8% | 16.8% | 26.2% |
World nominal GDP grew from $48 trillion in 2005 to $111,610.9 billion in 2024.
* Compiled and edited by the Japan in Data editorial team based on official government statistics.
Each of the three tabs carries a different series. The dollar figures come from the IMF, and the yen figures and world shares come from the Cabinet Office, so values for the same year differ slightly. Rather than mixing them in one table, the tabs keep each source separate so that every figure can be checked against its origin.
Per Capita: Japan’s Position Within the OECD
Apart from the size of the whole economy, the amount per person, found by dividing by population, is also widely cited. The same Cabinet Office document lists Japan’s rank among the member countries of the OECD (Organisation for Economic Co-operation and Development).
* Compiled and edited by the Japan in Data editorial team based on official government statistics.
According to the Cabinet Office, Japan’s nominal GDP per capita was $38,185 in 2005, 12th among OECD members; $49,620 in 2012, 10th; $41,096 in 2020, 18th; and $33,785 in 2024, 24th. The 2024 amount is $4,400 below the 2005 level, a difference of 11.5%.
Nominal GDP per capita in 2024 was $85,836 in the United States, $56,103 in Germany, $53,244 in the United Kingdom and $36,239 in South Korea. Japan ranks 4th in total economic size but 24th among OECD members per person. Total size and per capita figures place Japan in different positions.
Kaede’s Summary: Japan’s Position by Rank, Share and Currency
Looking back over the charts in this article, the question of how Japan’s world GDP rank has changed turns out to have three different answers, depending on the measure used. The facts observed so far are set out below, one by one.
Rank, share of the world, and the currency used as a measuring stick: all three come from the same statistics, but they move differently. Separating what each one measures, rather than choosing one view as correct, makes the meaning of each figure clearer. The observations so far fall into three points.
The answer to how Japan’s world GDP rank has moved is two places by rank, down to just over a third by share, and two lines running in opposite directions by currency. The same economy looks different depending on which indicator, which currency and which period are used. Setting all three side by side gives a basis for reading the figures accurately.
Frequently Asked Questions
Below are answers to three questions often searched about Japan’s GDP ranking. Each answer stays within what the published data can confirm, and names the source edition where the edition makes a difference to the figures.
Q1. I heard India overtakes Japan in 2026, pushing it to 5th. Is that true?
That account is based on the IMF’s October 2025 projection. The April 2026 edition revised it: the 2026 order is the United States, China, Germany, Japan, the UK and India, with Japan 4th and India 6th. The 2027 projection does place India ahead of Japan. Projections are revised with each edition, so the edition being cited is part of the answer.
Q2. Why is nominal GDP in yen at a record high while it has fallen in dollars?
The two series use different currencies. In yen, nominal GDP reached ¥666,441.9 billion in 2025, a fifth consecutive annual increase; in dollars, with 2012 set at 100, 2024 stands at 66.1. Converting between them involves the exchange rate, which the Cabinet Office notes as ¥140.5 per dollar in 2023 and ¥151.5 in 2024. This article goes as far as setting out these three facts.
Q3. How does a lower GDP rank affect public finances or daily life?
Whether there is an effect, and how large it is, cannot be confirmed from the data in this article. GDP measures the total value added produced within a country, and public finances and household conditions are published in separate statistics. How rankings behave as a measure is also discussed in our article on Japan’s passport ranking.
🔍 About the Fact-Check for This Article
Japan in Data fact-checks its articles. The evidence for the fact-check on this page is set out below.